


Expectations, and in particular inflation expectations, play a key role in the conduct of modern monetary policy. Expectations drive people’s behavior by influencing a wide range of economic decisions such as saving, investment, purchases of durable goods and wage negotiations. These decisions in turn affect real economic activity and actual inflation.
As a result, inflation expectations represent an important link in the monetary transmission mechanism—especially through the term structure of interest rates—and greatly influence the central bank’s ability to achieve price stability. It is crucial for a central bank to monitor inflation expectations, making sure that they remain well anchored and consistent with policy objectives. Since the economy is constantly buffeted by unanticipated shocks, short-term inflation expectations should reflect the effects of these shocks. For example, if energy prices increase suddenly due to a supply disruption, short-term inflation expectations should move up. This is completely consistent with medium-term price stability, if at the same time, forward inflation expectations—that is, expectations of inflation for after the supply disruption ends—do not move. This stability of longer-term inflation expectations in the face of movements in short-term inflation expectations is the hallmark of sound, effective and credible monetary policy.
In standard macroeconomic models it is trivial to measure inflation expectations: under the rational expectations assumption, any economic agent in the model could produce the unique inflation expectation for any horizon. In the real world, central banks must rely on various indirect approaches to measure inflation expectations: market-based measures, surveys of professionals such as economists and market participants, and surveys of households. All three types of measures have advantages and drawbacks. It is therefore important for a central bank to use a variety of measures that complement one another. Before turning to the focus of this talk—the measurement of household inflation expectations—I want to provide a quick summary of market-based and professional surveys.
The difference in yields between nominal and real government debt can be used to derive a measure of market inflation expectations for the price index used to protect the holders of real government debt from inflation. In the United States, that price index is the consumer price index (CPI). Thus, if the nominal 10-year yield is 3.5 percent and the real 10-year yield is 1 percent, one crude measure of average CPI inflation expected over the next 10 years would be 2.5 percent. Further, if the nominal 5-year yield is 3 percent and the real 5-year yield is 0.2 percent, then a crude measure of average CPI inflation expected over the next 5 years would be 2.8 percent and a crude estimate of the 5- to 10-year forward average CPI inflation would be 2.2 percent.
I say crude because such calculations ignore any difference in liquidity between and within the two types of debt, any compensation investors require for the uncertainty of the real value of nominal coupon securities and a variety of other issues, such as the fact that Treasury Inflation-Protected Securities (TIPS) are indexed to the CPI with a time varying lag.
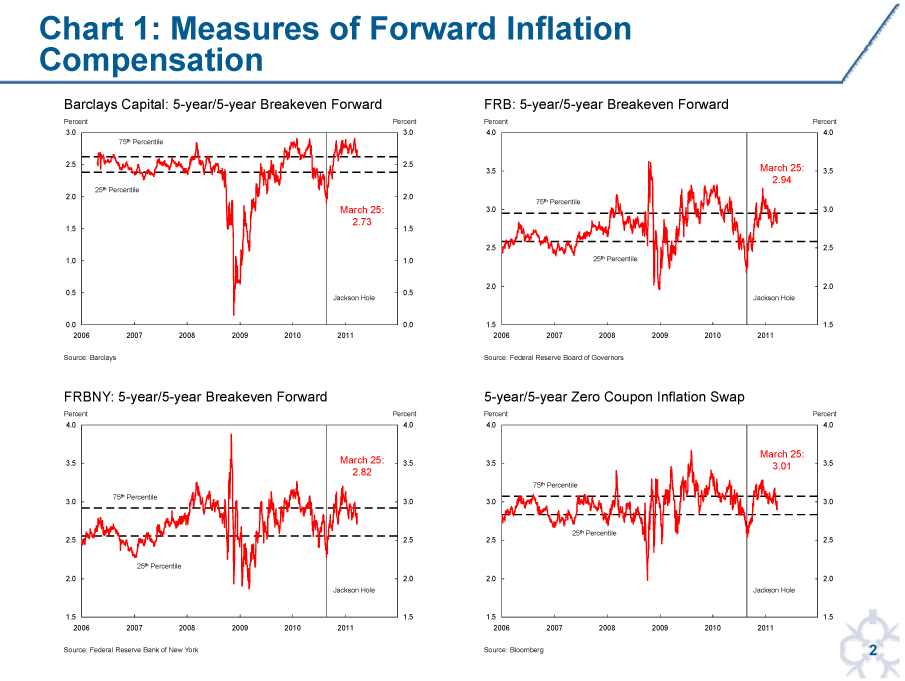
There are numerous ways to measure inflation expectations that take into account liquidity differences. For example, Chart 1 shows estimates of the 5- to 10-year forward inflation compensation constructed by Barclays, the research staff of the Federal Reserve Board, the New York Fed Markets Group and inflation swaps. The differences are produced by differing assumptions on the liquidity of various securities and the use of an estimated yield curve to produce the Board research staff estimates. No attempt is made to remove the compensation for inflation risk in these measures, thus these are estimates of compensation for expected and unexpected inflation.
There are clearly different short-term fluctuations in the various estimates, but they all show a similar pattern—with the exception of the height of the financial crisis, they have been contained within a range of just below 2.5 percent to just above 3 percent. CPI inflation has averaged historically about 0.3 to 0.5 percentage points above the inflation rate for personal consumption expenditures (PCE), the price index for which the Federal Reserve Board members and Reserve Bank presidents provide forecasts four times per year. Estimates of the amount of compensation investors require for inflation uncertainty at this forward horizon vary from close to 0 percent to more than 1 percent.
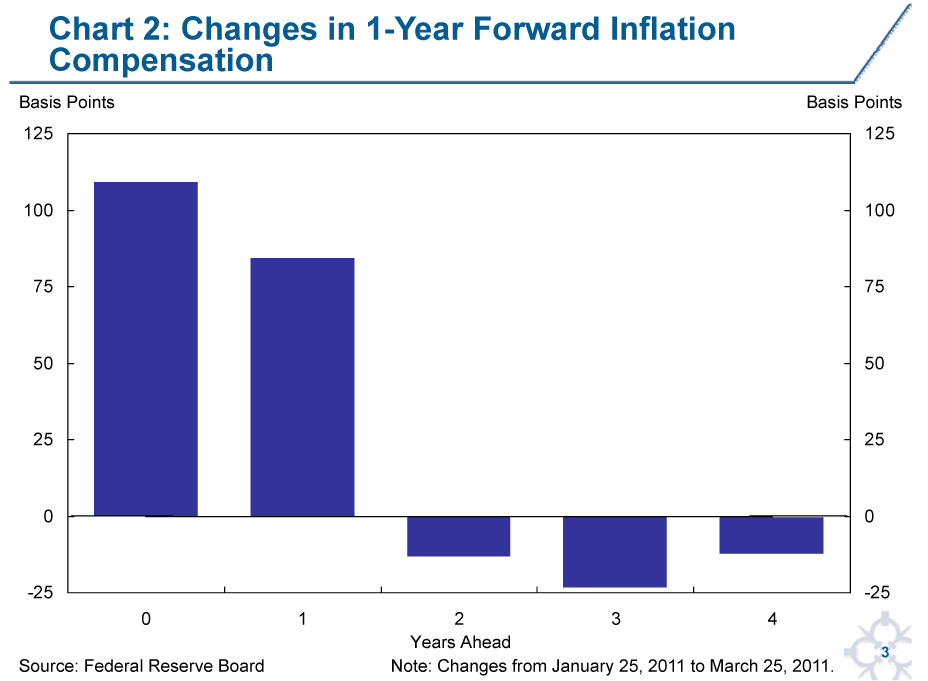
Yield curve model-based estimates can provide a decomposition of the whole forward structure of inflation expectations. As shown in Chart 2 for the Board research staff measure of inflation compensation, the effect of the recent surge in energy prices is centered on short-term inflation compensation with slightly negative movement in forward inflation compensation from 2013 onward. Of course, the recent surge in energy prices has also increased both short-term inflation and uncertainty around future inflation. Thus, the increase in short-term inflation compensation reflects both factors.
There are numerous surveys of economists and market participants that give additional information on inflation expectations. Many of you in this room are respondents to these surveys. As with the market-based measures, the surveys produce responses for a specific price index, usually the CPI and the CPI excluding food and energy. The Survey of Professional Forecasters (SPF) also asks numerous questions about the PCE deflator. Compared with market-based measures, the surveys have the advantages of not being affected by varying market liquidity and not requiring any adjustment for inflation risk compensation. Further, the SPF asks a number of questions about short-run inflation uncertainty.
These forecasts from professionals about core inflation and long-run average inflation provide additional insight into the stability of forward inflation expectations. Since many of the shocks that move around total inflation at high frequencies are removed from core inflation, forecasts of core inflation in the short to medium term provide an additional check on the anchoring of inflation expectations. Recently, with the large increase in economic slack produced by the Great Recession, there has been considerable debate on the relative strengths of slack to generate a decline in inflation versus the power of anchored inflation expectations to restrain this decline.
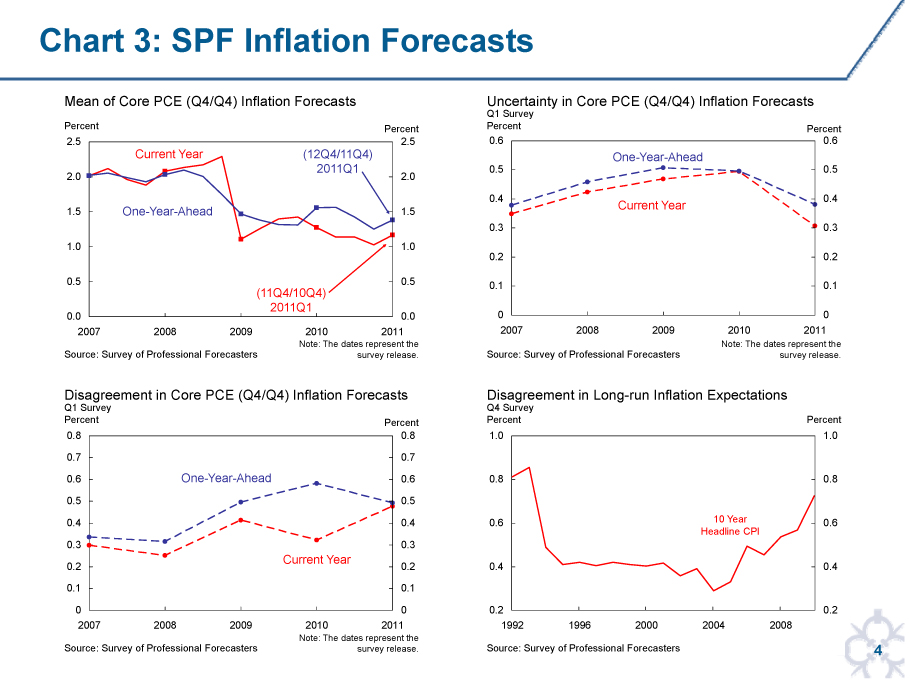
Chart 3 shows some detail on recent behavior of the forecasts for core PCE inflation from the SPF and dispersion in long-run CPI inflation forecasts. The first panel shows the average of point forecasts since 2007 for the current year and year-ahead core PCE inflation rate. As one would expect, the current year forecast is more variable, and for the most part the year-ahead forecast remains above the current year forecast after the financial crisis, consistent with the pull of anchored inflation expectations. However, both sets of forecasts are still below what some have called, based on the Summary of Economic Projections, the mandate consistent range of Federal Open Market Committee participants.
The second panel of Chart 3 shows a measure of uncertainty for these forecasts. Here we can see that uncertainty increased as the financial crisis took hold but has returned to 2007 levels recently. The third panel shows that disagreement across forecasters also increased with the financial crisis and has not returned to pre-crisis levels. Much of this disagreement appears to be related to differing views on the strength of standard Phillips curve dynamics versus other approaches to inflation dynamics. The final panel shows the disagreement in 10-year average CPI forecasts over the last 20 years. As you are aware, one of the great successes of the Federal Reserve in the 1980s and 1990s was a reduction in long-run inflation expectations. Indeed, since 1998, the median forecast from this SPF question has stayed within a very narrow range. However, the amount of disagreement around this median has increased recently. Much of this increase is related to lower forecasts for the 10-year average.
During the past decade many central banks have begun to explore ways to improve through surveys their measurement and understanding of the public’s inflation expectations. At the New York Fed in November last year we had a conference where many different aspects of this research were discussed. In addition to initiating new surveys and gradually moving from traditionally qualitative to more quantitative questions and measures, research is being conducted to analyze the quality and information content of survey-based measures of consumer inflation expectations.
In late 2006 at the New York Fed we initiated a major research project to examine a number of issues: First, what is the best way to measure the public’s inflation expectations in terms of inflation concepts and forecast horizon? Second, how do households form and update their expectations of future inflation: to what extent are they based on past inflation experiences and what information sources do they rely on? Third, do people act on their expectations and if so, how? My remarks today will mainly focus on the first set of issues, but I will conclude with some preliminary research on the other two.
Despite the importance of inflation expectations for forecasting future inflation and economic activity and as a key link in the monetary transmission mechanism, surprisingly little is known to directly answer these questions. This was partly because back in 2006 when we started out, macroeconomists had enjoyed around 20 years of success with models where these questions were answered in a simple and unambiguous manner. As we have learned painfully from the financial crisis, the success of these models was much more due to luck than deep insight.
Our relative ignorance was also partly because economists do not receive detailed training in the design of survey questions. One of the issues that sparked our initial interest was the wording of questions. We found most questions on inflation expectations did not directly ask about inflation but instead asked about prices. For example, the Thomson Reuters/University of Michigan Survey (the Michigan Survey from now on) asks about the change in “prices in general” or the Bank of England/GfK NOP survey asks about the expected “change in prices in shops generally.” Not being experts in survey design, we decided that we needed a wide collaboration to understand the implications of asking about prices in general and whether it was possible to ask directly about the rate of inflation.
We formed a cross-disciplinary team among Federal Reserve research staff, academic economists, and psychologists at Carnegie Mellon University who specialize in behavioral decisionmaking, as well as risk perception and communication. The initial part of the project was structured in three stages. The first two stages—preliminary inquiries conducted through phone and Internet surveys—gauged how individuals interpreted the Michigan Survey questions and how they would respond to alternative questions about future inflation. The Internet survey also “piloted” questions on wage expectations and inflation uncertainty to expand the information currently elicited by the Michigan Survey. These preliminary inquiries guided the final formulation of the questions for the third stage—the actual implementation of an alternative experimental Internet survey of inflation expectations using a sample panel of households drawn from previous respondents to the Michigan survey.
Reliable measurement requires that respondents agree with one another—and with economic modelers—on what the survey questions mean. For the questions asked in professional surveys, there is little room for differing interpretations of the inflation concept since forecasts for a specific price index are requested. For questions asked of households, specific price indexes are not used so respondents vary in their interpretation of the inflation concept. Thus, their responses may display disagreement not about expectations but the concept of inflation being used. Indeed, one feature that the Michigan Survey’s question about “prices in general” shares with other surveys is a high dispersion of responses around the median. This evidence of disagreement is in part related to observable characteristics of respondents such as age, gender, education and income. However, the differences in responses across demographic groups far exceed the variations in inflation experienced by the groups.
When we probed survey respondents about their understanding of changes to “prices in general” (the Michigan Survey question), we found that a significant fraction believed we were inquiring about the prices they themselves recently paid—often prices that had increased or decreased markedly, such as those for food or gasoline. This tendency to think more about prominent price changes in one’s own experience is less common among respondents with higher financial literacy. By contrast, when we asked about expectations for the “rate of inflation,” respondents tended to think less about a few salient price changes specific to their own experiences and more about price changes across a broader set of items or about changes in the cost of living—a result that aligns more with economists’ definition of inflation as a sustained increase in the overall price level. Asking about the rate of inflation directly therefore produces answers more consistent with the concept of forward inflation expectations of interest to central banks.
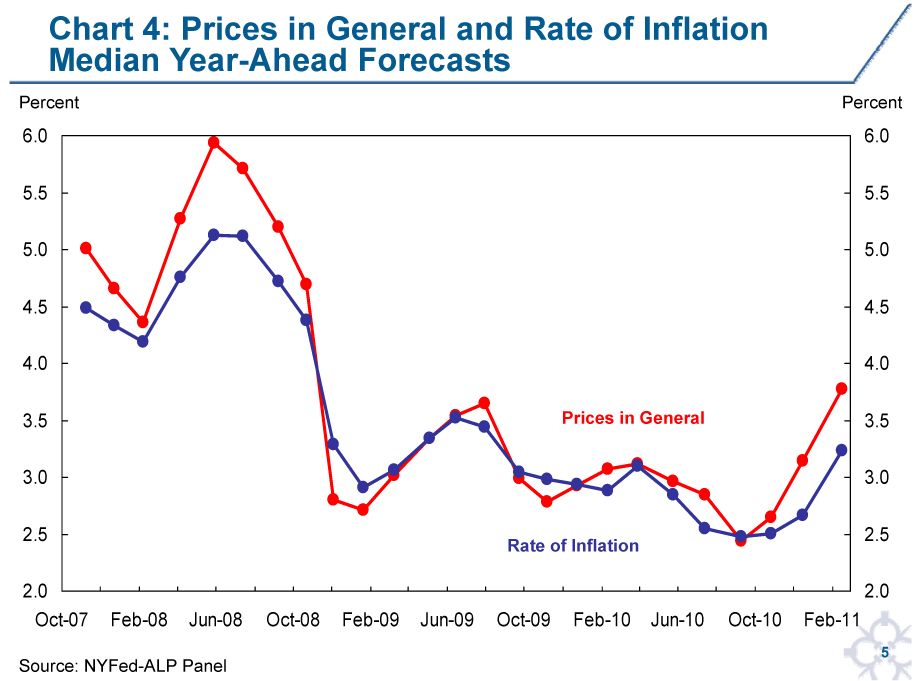
Chart 4 plots the time series of median responses from our experimental survey to a “prices in general” question and a rate of inflation question. One can see that the median expectation for the rate of inflation question is less variable. We also find that the dispersion of responses is significantly larger with the “prices in general” question. Further, in our initial investigations we had established evidence that many respondents would prefer to give a range rather than a point estimate and that most households were able to answer questions about their uncertainty over future inflation. We had also found our measure of individual forecast uncertainty to be positively correlated with the width of any range of responses given to the standard point forecast questions. Thus, we added questions eliciting from our panel their subjective uncertainty about future inflation. I will show you an example of such a question in a minute.
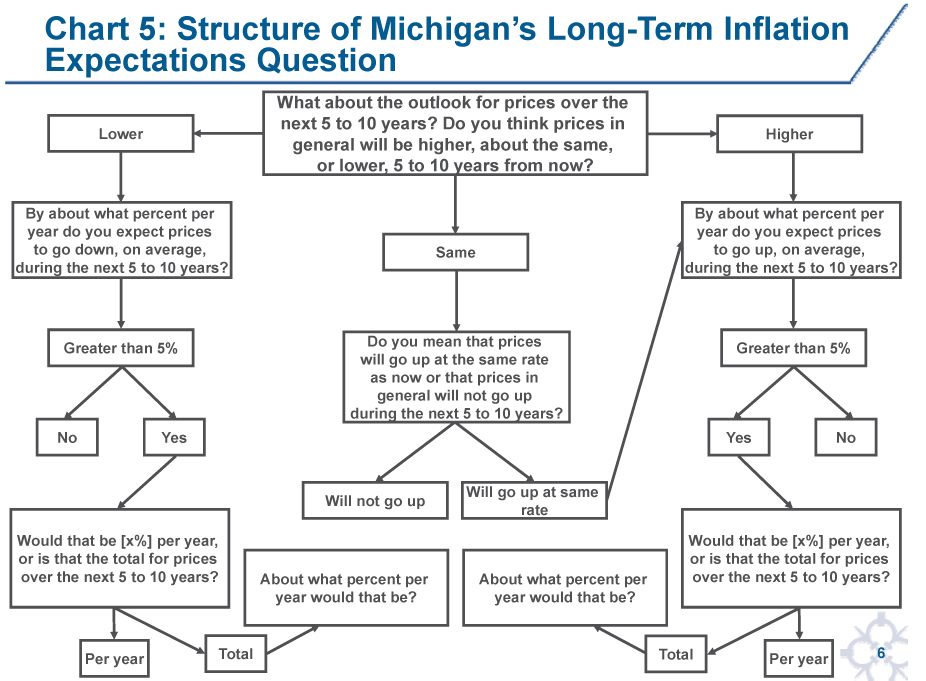
As emphasized above, anchoring forward inflation expectations is crucial for monetary policy. In the Michigan survey, information on forward inflation expectations is generated by a question asking about “the change in prices in general over the next 5 to 10 years.” Our initial exploratory work confirmed that many households were confused by this wording but that there was overwhelming evidence that long-term average expectations were being reported. Considering the rather elaborate structure of the Michigan questions shown in Chart 5, it also appears that small changes in the various challenges could lower the median response by a significant margin. Further, asking about the rate of inflation directly produced answers more consistent with the concept of forward inflation expectations of interest to central banks.
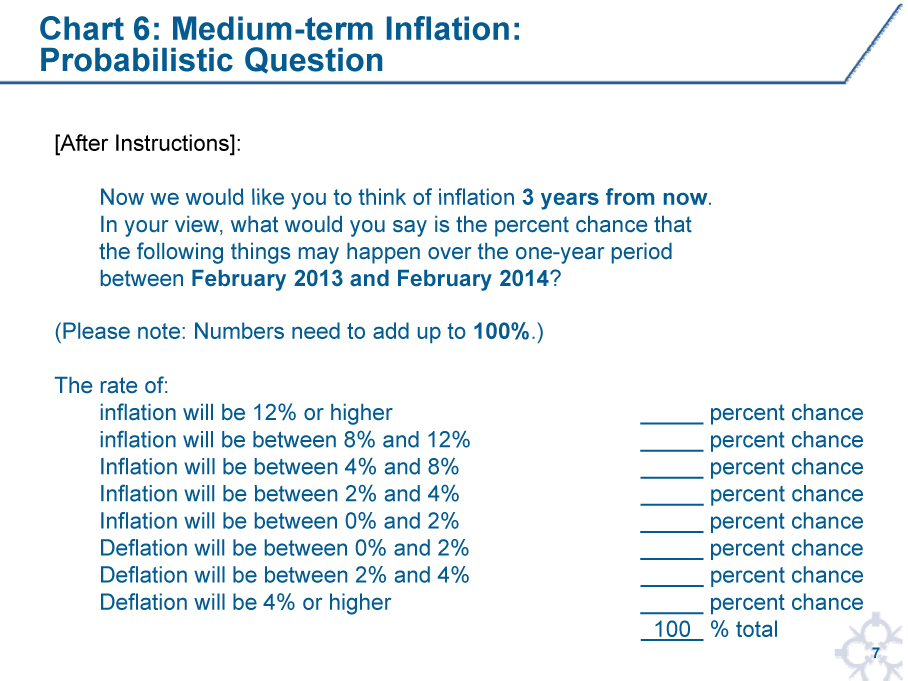
Rather than replicating the Michigan long-term inflation expectation question replacing “prices in general” with the “rate of inflation” we decided to work with a medium-term explicit horizon and use only a probabilistic version of the question. So for example, in the most recent fielding of our survey, the panel was asked:
In your view, what would you say is the percent chance that the following things may happen to the rate of inflation/deflation over the one-year period between February 2013 and February 2014?
Chart 6 gives you the question in full.
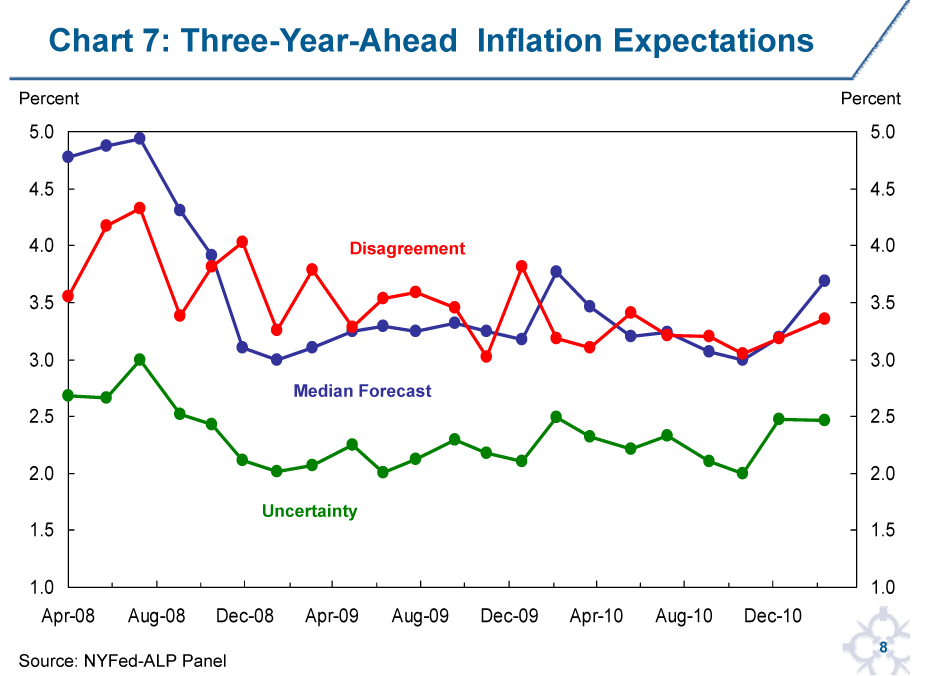
We have been fielding the forward inflation expectation question since spring 2008, and Chart 7 contains some time-series information from the responses. We use established statistical techniques to estimate continuous probability distributions from each individual set of responses. We then find the median of the medians of the individual distributions to represent the average forward expectation and the upper and lower quartiles of the individual medians to measure disagreement across respondents. For our measure of uncertainty we report the median of the individual inter-quartile ranges.
As a complement to attempting to improve the measurement of household forward inflation expectations, we have also been investigating expectations about wage growth. Because firms and workers may negotiate changes in wages to be in line with their expected rate of inflation, data on wage expectations are an additional information source for analyzing inflation dynamics and the interaction between wage and price determination. Furthermore, discrepancies between expected changes in wages and expected inflation may affect households’ financial decisions. Despite the obvious importance of wage expectations, information on wage expectations is particularly scarce.
In formulating a question on wage expectations we needed to pose a hypothetical situation to gain information of direct relevance to inflation. It is easiest to illustrate this by giving you the format and exact wording of the question:
We first asked individuals who reported to be working for pay how many jobs they had. We then informed them that in some subsequent questions we would ask about their MAIN job, which we defined to be the job at which they usually work the most hours. We then ask:
“Suppose that, 12 months from now, you actually are working in the exact same [MAIN] job at the same place you currently work, and working the exact same number of hours. Twelve months from now, do you expect your earnings on this job, before taxes and deductions, to have gone up, or gone down, or stayed where they are now?”
For those who said gone up or gone down we then asked:
“By about what percent do you expect that your hourly earnings on this job, before taxes and other deductions, will have gone [UP/DOWN], 12 months from now, if you actually are working in the exact same job at the same place you currently work, and working the exact same number of hours?”
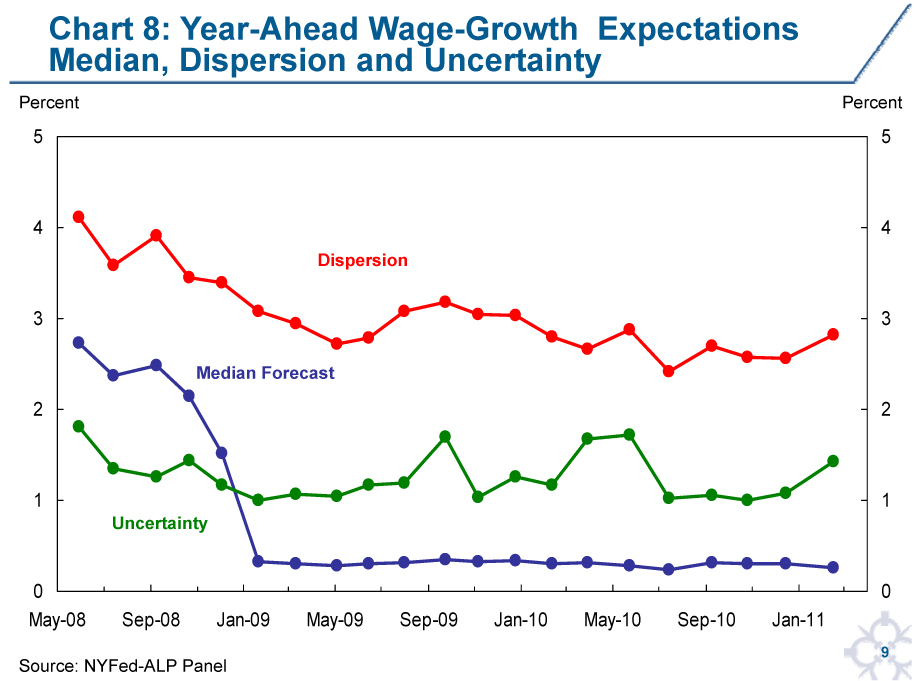
As in the rest of our work we also elicited uncertainty around this wage expectation. Chart 8 shows a time series of the median response and inter-quartile range to the point prediction question along with the average uncertainty as defined above. Given the nature of this question, the inter-quartile range is best interpreted as dispersion rather than disagreement. The results around the height of the financial crisis are striking: the median response fell from just under 3 percent to just above 0 percent as many more respondents opted for the “stayed where they are now” option. Moreover, these low median expectations of wage growth appear unaffected by the recovery in economic activity. The dispersion of responses around the median is relatively high, although lower than before the crisis. The individual uncertainty around wage growth is lower than around inflation but interestingly does show some increases coincident with accelerations in economic activity during the recovery which we don’t find in individual inflation uncertainty.
Turning to the second set of general questions I started with, knowing how consumers form expectations and revise them in response to new information is relevant for many aspects of monetary policy. As noted previously, the large cross-sectional variation in inflation forecasts across survey respondents is inconsistent with the traditional rational expectations framework in which all agents are assumed to share the same information set and expectations. This has led to alternative models in which this heterogeneity is explained by a reliance of agents on different models for forecasting, the use of different information sets and different capabilities for processing information. While in a full-information, rational-expectations world there is no role for constant central bank communication, such a role becomes crucial in a world with learning.
Since in our survey we have utilized a panel design, we will have the ability to make progress in understanding how expectations are formed and revised over time. Initial analysis suggests that the differences in individual forecasts are persistent and probably related to different forecast models and reference information and not just different experiences. We have also found that a respondent expressing higher-than-average uncertainty in the previous survey is more likely to change their point forecast in the current survey.
A better understanding of the factors affecting individual inflation expectations will also help evaluate and predict the impact and effectiveness of central bank policy decisions and communication strategy. Specifically, it will improve the central bank’s capacity to evaluate the strengths and weaknesses of various communication tools and strategies designed to keep inflation expectations well anchored. The ability to do so is especially important at times such as the current one, in which central banks have been expanding their toolkits and conducting traditional as well as nontraditional monetary policy.
The third and final broad question that would benefit from additional research is whether and how people act on their expectations. The theoretical link between inflation expectations and realized inflation and consumer decisions occurs through several channels. In addition to affecting future wages and prices through influencing the outcomes of nominal wage contract negotiations and through price-setting behavior of firms, there is the crucial link of real interest rates (nominal rates less expected inflation) with intertemporal consumption and investment decisions. In addition, households that fear high inflation are expected to reduce the amount of money they hold and keep more of their wealth in real assets such as land or gold, which are considered better hedges against inflation. Inflation also raises the effective tax rate on income earned from investing and saving. As a result, people may invest less and save less. However, at present there is little direct empirical evidence of the strength and nature of these theoretical links.
These are important questions, and a variety of approaches can be brought to bear to answer them. Surveys, field experiments and experiments in the lab can all be very useful to further our understanding of these issues, which lie at the heart of the mandate of any central bank. Of course many economists are perhaps appropriately skeptical about whether the results from many experiments can be generalized. Some recent results from our survey might reassure some of these economists. Working with the Rand Corporation, which runs the Internet survey for our inflation questions, we designed an experiment involving nominal future payoffs to assess whether the responding households would behave in ways consistent with their reported inflation expectations. The results confirmed that on average households used a real interest rate based on their reported inflation expectation in choosing between the nominal future payoffs.
Thank you for listening to me today. I would be happy to take some questions on our research on inflation expectations.
__________________________________________
1Wilbert van der Klaauw, Giorgio Topa, Robert Rich, Olivier Armantier, Basit Zafar and Joseph Tracy. The results from the New York Fed–American Life Panel Survey I will discuss today reflect data collected through mid-March 2011. Papers containing more detail on the research I have summarized today can be found on the New York Fed website.

