


In my talk, I'll argue that the economic outlook has improved considerably. Despite this, we are still very far away from achieving our dual mandate of maximum sustainable employment and price stability. Faster progress toward these objectives would be very welcome and need not require an early change in the stance of monetary policy.
However, I'll also focus on some issues with respect to inflation that will merit careful monitoring. In particular, we need to keep a close watch on how households and businesses respond to commodity price pressures. The key issue here is whether the rise in commodity prices will unduly push up inflation expectations.
Inflation expectations are well-anchored today and we intend to keep it that way. A sustained rise in medium-term inflation expectations would represent a threat to our price stability mandate and would not be tolerated.
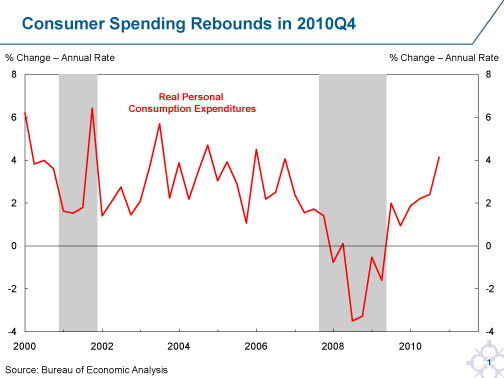
Turning first to the economic outlook, the situation looks considerably brighter than six months ago. On the activity side, a wide range of indicators show a broadening and strengthening of demand and production. For example, on the demand side, real personal consumption expenditures rose at a 4.1 percent annual rate during the fourth quarter. This compares with only a 2.2 percent annual rate during the first three quarters of 2010
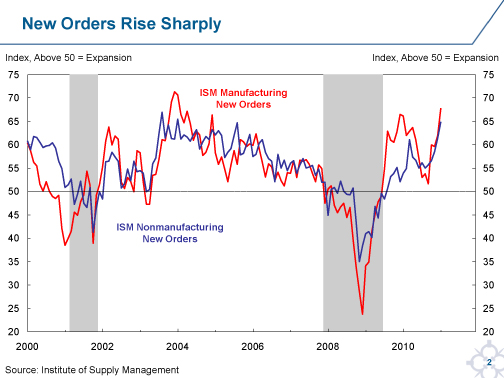
(Chart 1). Orders and production are following suit. For example, the Institute of Supply Management index of new orders for manufacturers climbed to 67.8 in January, the highest level since January of 2004 (Chart 2).
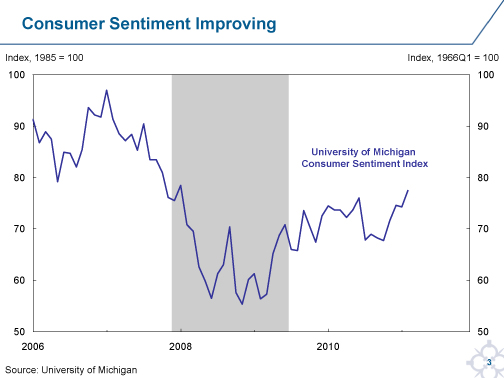
The revival in activity, in turn, has been accompanied by improving consumer and business confidence. For example, the University of Michigan consumer sentiment index rose to 77.5 in February, up from 68.9 six months earlier (Chart 3).
Indeed, the 2.8 percent annualized growth rate of real gross domestic product (GDP) in the fourth quarter may understate the economy's forward momentum. That is because real GDP growth in the quarter was held back by a sharp slowing in the pace of inventory accumulation. The revival in demand, production and confidence strongly suggests that we may be much closer to establishing a virtuous circle in which rising demand generates more rapid income and employment growth, which in turn bolsters confidence and leads to further increases in spending. The only major missing piece of the puzzle is the absence of strong payroll employment growth. We will need to see sustained strong employment growth in order to be certain that this virtuous circle has become firmly established.
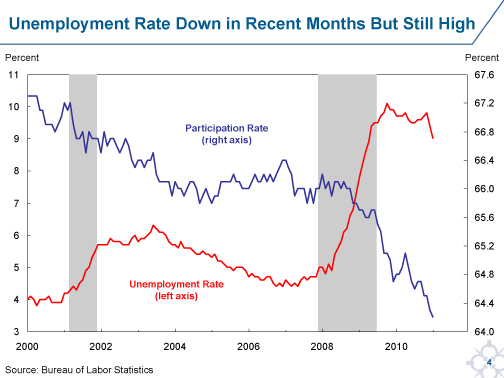
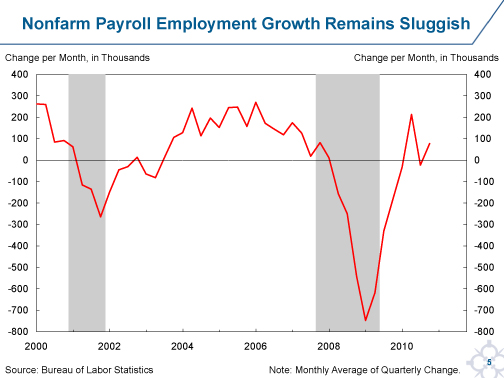
With respect to the labor market, there are conflicting signals. On one hand, the unemployment rate has fallen sharply over the past two months, dropping to 9.0 percent from 9.8 percent two months earlier (Chart 4). This is the biggest two-month drop in the unemployment rate since November of 1958. On the other hand, payroll employment gains have remained very modest—rising by only 83,000 per month over the last three months (Chart 5). Such modest payroll growth is not consistent with a sustained drop in the unemployment rate.
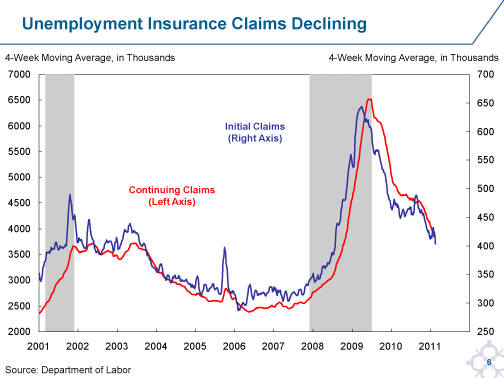
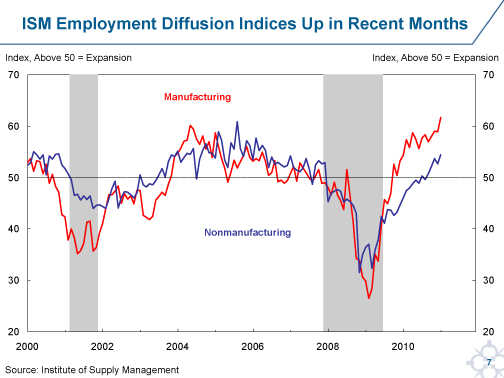
The true story doubtless lies somewhere in between—but probably more on the side of the household survey that tracks unemployment. That is because measured payroll employment growth in January was probably temporarily depressed by unusually bad winter weather. Although some of the recent decline in unemployment is due to a drop in the number of people actively seeking work, the household survey does show a pick-up in hiring. Other labor market indicators, such as initial claims and the employment components of the ISM surveys for manufacturing and nonmanufacturing, have also shown improvement recently
(Chart 6 and Chart 7), which suggests that the weakness in payroll growth is the outlier.
Although there is uncertainty over the timing and speed of the labor market recovery, I do expect that payroll employment growth will increase considerably more rapidly in the coming months. We should welcome this. A substantial pickup is needed. Even if we were to generate growth of 300,000 jobs per month, we would still likely have considerable slack in the labor market at the end of 2012.
In monitoring employment trends, we also need to recognize that the data are likely to be quite noisy on a month-to-month basis. This is particularly the case during the winter months, when weather can play an important role. Recall, for example, the aftermath of the blizzard of 1996 in the Northeast when the February payroll employment count was originally reported as rising by 705,000 workers. It will be important not to overreact to monthly data but to focus on the underlying trend.
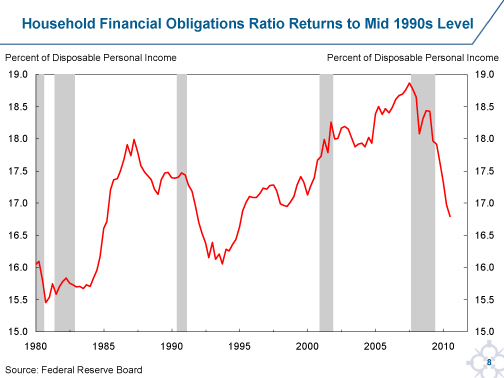
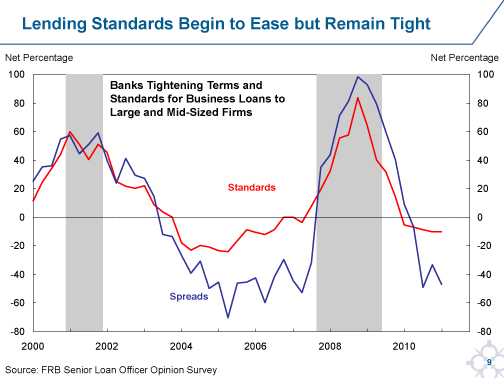
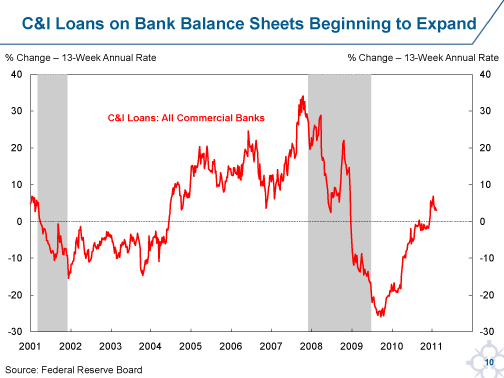
So why is the economy finally showing more signs of life? In my view, the improvement reflects three developments. First, household and financial institution balance sheets continue to improve. On the household side, the saving rate, which moved up sharply in 2008 and 2009, appears to have stabilized in the 5 percent to 6 percent range. Meanwhile, debt service burdens have fallen sharply to levels that prevailed during the mid-1990s. Debt service has been pushed lower by a combination of debt repayment, refinancing at lower interest rates and debt write-offs (Chart 8). Financial institutions have strengthened their balance sheets by retaining earnings and by issuing equity. For many larger institutions, a release of loan loss reserves has been important in supporting earnings. Credit availability has improved somewhat as very tight standards start to loosen (Chart 9). As a result, some measures of bank credit are beginning to expand again
(Chart 10).
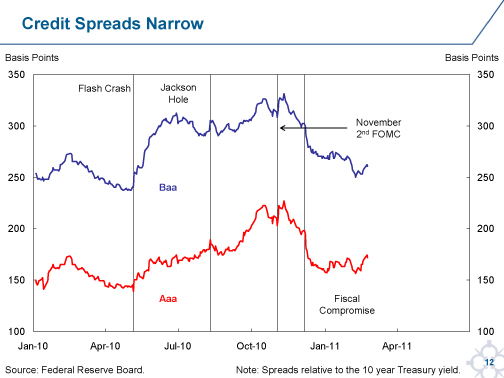
Second, monetary policy and fiscal policy have provided support to the recovery. On the monetary policy side, the unusually low level of short-term interest rates and the Federal Reserve's large-scale asset purchase programs (LSAPs) have fostered a sharp improvement in financial market conditions. Since August 2010, for example, when market participants began to anticipate that the Federal Reserve would initiate another LSAP, U.S. equity prices have risen sharply and credit spreads have narrowed (Chart 11 and Chart 12). Long-term interest rates have moved higher after initially declining, but this does not appear troublesome as it primarily reflects the brightening economic outlook.
On the fiscal side, the economy has been supported by the shift in policy toward near-term accommodation. In particular, the temporary reduction in payroll taxes is providing substantial support to real disposable income and consumption. This could have a particularly strong impact on growth during the first part of the year.
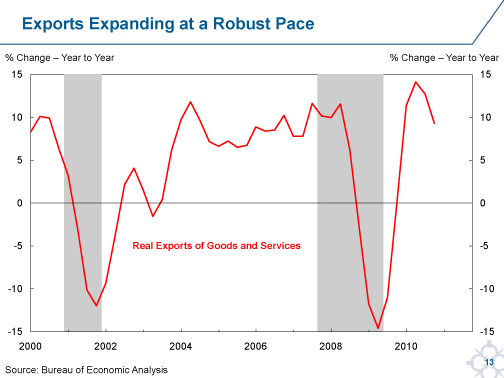
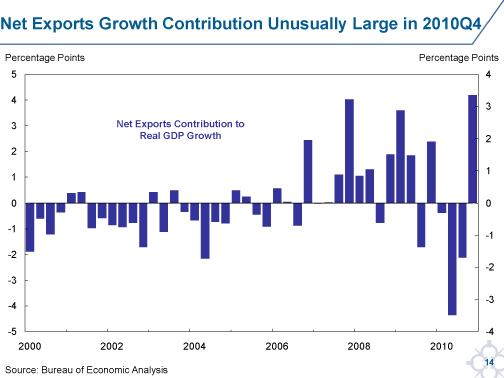
Third, growth abroad—especially among emerging market economies—has been strong and this has led to an increase in the demand for U.S.-made goods and services. Over the four quarters of 2010 real exports rose 9.2 percent (Chart 13). After a disappointing performance earlier in the year, U.S. net exports surged in the fourth quarter (Chart 14).
The firming in economic activity, in short, is due both to natural healing and past and present policy support.
In this regard, it important to emphasize that we did expect growth to strengthen. We provided additional monetary policy stimulus via the asset purchase program in order to help ensure the recovery did regain momentum. A stronger recovery with more rapid progress toward our dual mandate objectives is what we have been seeking. This is welcome and not a reason to reverse course.
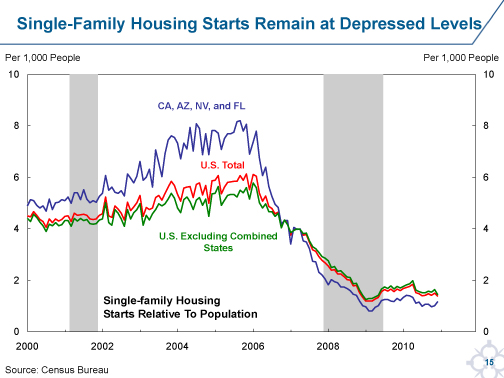
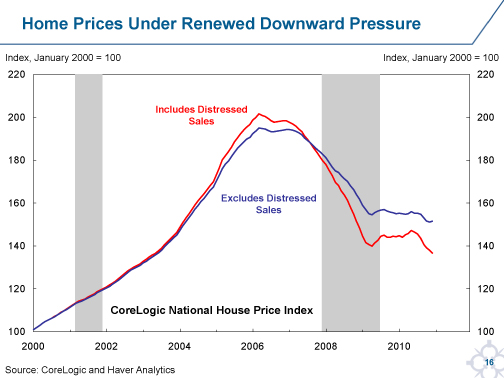
We also have to be careful not to be overly optimistic about the growth outlook. The coast is not completely clear—the healing process in the aftermath of the crisis takes time and there are still several areas of vulnerability and weakness. In particular, housing activity remains unusually weak and home prices have begun to soften again in many parts of the country (Chart 15 and
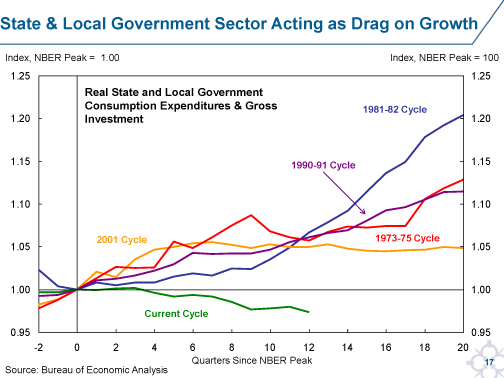
Chart 16). State and local government finances remain under stress, and this is likely to lead to further fiscal consolidation and job losses in this sector that will offset at least a part of the federal fiscal stimulus (Chart 17). And we cannot rule out the possibility of further shocks from abroad, whether in the form of stress in sovereign debt markets or geopolitical events. Higher oil prices act as a tax on disposable income, and the situation in the Middle East remains uncertain and dynamic. Also, we cannot ignore the risks stemming from the longer-term fiscal challenges that we face in the United States.
But in the near-term, the most immediate domestic problems may recede rather than become more prevalent. On the housing side, stronger employment growth should lead to increased household formation, which should provide more support to housing demand. And anxieties about the large overhang of unsold homes represented by the foreclosure pipeline may overstate the magnitude of the excess supply of housing. Families that have lost their homes through foreclosures are likely to seek new homes as their income permits, even though many may re-enter the housing market as renters rather than buyers. On the state and local side, a rising economy should boost sales and income tax revenue and help narrow near-term fiscal shortfalls.1
Moreover, although we do need to remain ever-watchful for signs that low interest rates could foster a buildup of financial excesses or bubbles that might pose a medium-term risk to both full employment and price stability, risk premia on U.S. financial assets do not appear unduly compressed at this juncture.
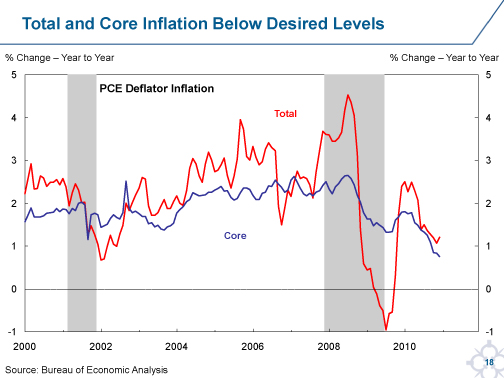
On the inflation side of the ledger, there are some signs that core inflation is now stabilizing. However, both headline and core inflation remain below levels consistent with our dual mandate objectives—which most members of the FOMC consider to be 2 percent or a bit less on the personal consumption expenditures (PCE) measure.
Recent evidence shows that the large amount of slack in the economy has contributed to disinflation over the past couple of years. This can be seen in the steady decline in core inflation between mid-2008 and the end of 2010. As shown in Chart 18, core PCE inflation in December had risen at just 0.7 percent on a year-over-year basis, down from 2.5 percent in mid-2008. Slack in our economy is still very large, and this will continue to be a factor that acts to dampen price pressures.
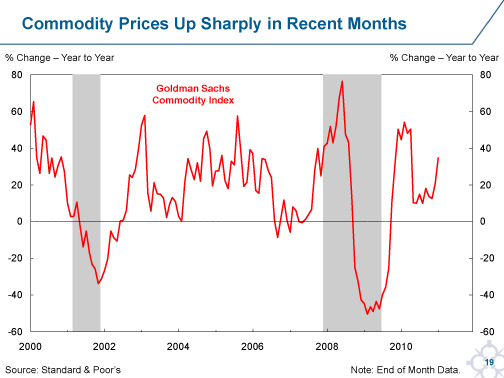
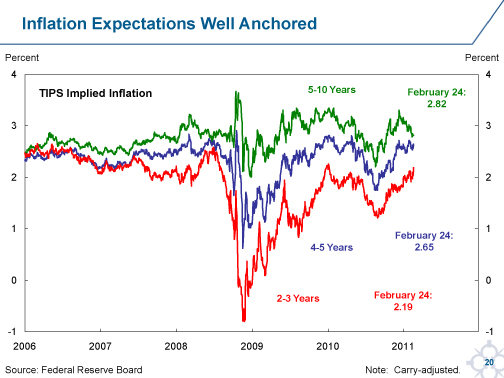
Nevertheless, there are several reasons why we need to be careful about inflation even in an environment of ample spare capacity. First, commodity prices have been rising rapidly (Chart 19). This has already increased headline inflation relative to core inflation, and the commodity price changes that have already taken place will almost certainly continue to push the headline rate on year-over-year basis higher over the next few months. Second, some of this pressure could feed into core inflation. Third, medium-term inflation expectations have recently risen back to levels consistent with our dual mandate objectives (Chart 20). If medium-term inflation expectations were to move significantly higher from here on a sustained basis, that would pose a risk to inflation and, thus, would have important implications for monetary policy.
With respect to the inflation outlook, I think there are four important questions that deserve attention.
- How much slack is there in the economy? In other words, how fast can the economy grow for how long until the economy is close to full employment?
- Are there speed-limit effects on inflation? In other words, could inflation rise because the rate of economic growth was unusually high, even though plenty of slack remained in the economy?
- Given the emergence of such economies as China and India, can commodity price pressures be safely ignored as temporary “noise” in terms of the long-term inflation outlook or are these pressures likely to prove persistent? If commodity price pressures persisted, this could undercut one rationale for focusing on core measures of inflation—the argument that core measures are better predictors of future headline inflation than today's headline rate.
- What can the Federal Reserve do to ensure that inflation expectations stay well-anchored?
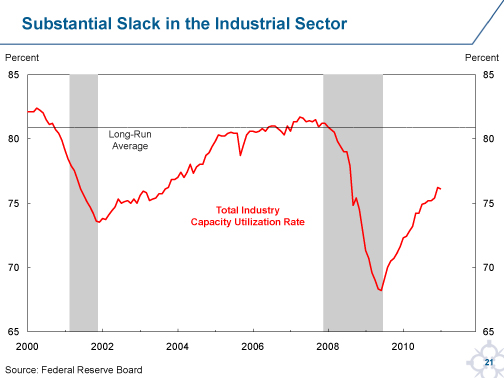
With respect to the first question, the economy retains a very large amount of slack by virtually all measures. For example, last month the industrial capacity utilization rate was 76.1 percent. This compares with a long-term average of 80.9 percent (Chart 21). Similarly, the current unemployment rate of 9 percent is well above most estimates of the non-accelerating inflation rate of unemployment (NAIRU)—the lowest rate of unemployment consistent with sustained price stability.
In the pre-crisis period, the NAIRU was likely in the region of 4.5 percent to 5 percent. There are several reasons why the NAIRU may now be higher. First, extended unemployment compensation benefits create incentives for prospective workers to keep looking for better jobs rather than accept less attractive positions. Empirical work on this subject suggests that the NAIRU might currently be roughly 1 percentage point higher because of this factor. However, this effect will only persist for as long as the extended benefits are in place.
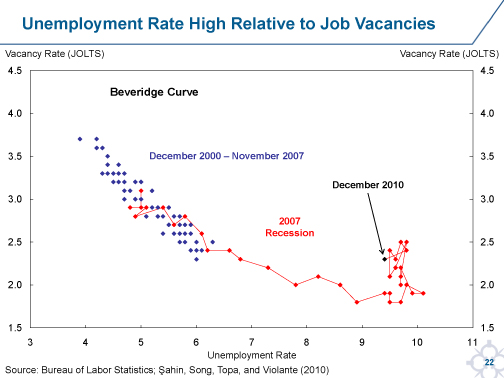
Second, the rise in unemployment has been associated with an increase in the degree of mismatch between unemployed workers' job skills and available job vacancies. Some cite the upward shift in the Beveridge curve, which illustrates the relationship between unemployment and job vacancies (Chart 22), as evidence of this effect.
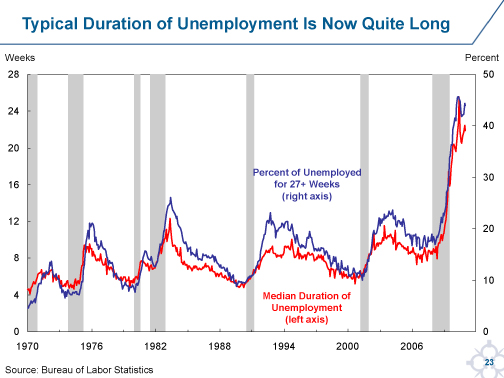
Third, the longer that people are unemployed, the more their skills tend to atrophy, which makes it harder for them to become employed in the future. For unemployed workers, the median duration of unemployment has climbed and a growing proportion of the unemployed has been jobless for long periods (Chart 23).
In my view, these last two factors have probably pushed up the NAIRU by 0.5 to 1 percentage point on top of the about 1 percentage point effect of extended unemployment benefits, which is likely to be a temporary effect. Taken together, this suggests that the current NAIRU might be between 6 percent and 7 percent.
Although undesirable, this rise should not create concern about the medium-term inflation outlook. First, even the higher estimate of NAIRU is still far below the current unemployment rate of 9 percent. Second, as discussed above, much of this rise is likely to be temporary rather than permanent. As the labor market improves, the extension of unemployment claims benefits will almost certainly be allowed to lapse. When this occurs, the NAIRU is likely to drop back to somewhere in the region of 5 percent to 6 percent.
Third, some of the evidence that the NAIRU has increased is not particularly compelling. For example, the loop in the Beveridge curve that is evident now has been seen in past business cycles—cycles in which there was no persistent rise in the NAIRU. This strongly suggests that the rise in job mismatch has a cyclical component. Fourth, the 9 percent unemployment rate may understate the amount of labor market slack. That is because the labor participation rate has fallen sharply.
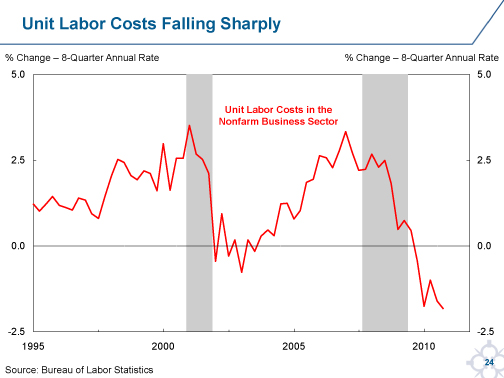
In my view, the large gap between the current unemployment rate and the long-run NAIRU suggests there is little payoff from investing much energy to more precisely estimate the NAIRU. As the economy expands and the unemployment rate falls, we will have plenty of time to be able to refine our estimates of NAIRU in light of what happens to labor cost trends such as the employment cost index, and to unit labor costs. Currently, all these measures are quiescent and consistent with a large amount of labor market slack (Chart 24).
The second question is whether the economy could grow so fast that inflation pressures could rise even with an unemployment rate still well above the NAIRU. The notion is that at very fast growth rates wages and prices might have to rise in order to funnel labor and capital to those areas where demand and output were rising particularly rapidly.
Although this possibility shouldn't be ruled out, we should not be too worried about this, particularly if growth is broadly based. In particular, the economy is not growing quickly right now relative to past recoveries. For example, in the rebound from the comparably deep early 1980s recession, the annualized growth rate exceeded 7 percent for five consecutive quarters. Moreover, empirically there is little historical evidence that discontinuous “speed limit” effects play a significant role in influencing inflation in the United States.
The third issue is whether the rise in commodity prices will turn out to be persistent and, if so, how this might impact the inflation outlook. Recently, commodity prices have risen sharply. For example, the spot GSCI—a broad measure of commodity prices—has risen more than 35 percent over the past year. This was in train before the upheavals in the Middle East raised market concerns about potential disruption to oil supplies, pushing energy prices—though not other commodity prices—still higher. Commodity price pressures are pushing measures of headline inflation above measures of core inflation, which exclude food and energy prices. How worried should policymakers be about this development?
Although there have been commodity price cycles in the past, commodity prices have not consistently increased relative to other prices, and indeed have declined in relative terms over the very long term. Historically, if commodity prices rose sharply in a given year, it has been reasonable to expect that these prices would stabilize or fall within a year or two. This property has been important because it has meant that measures of current “core” inflation, rather than current headline inflation, have been more reliable in predicting future headline inflation rates.
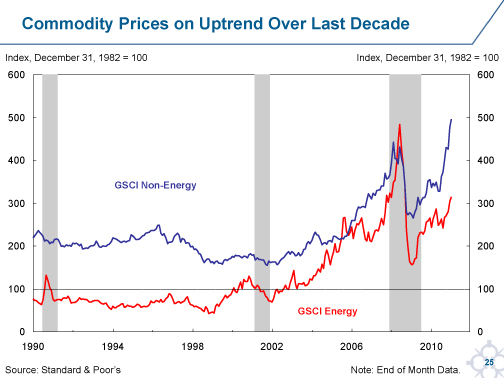
In contrast, over the past decade, commodity prices generally have been on an upward trend. For example, as shown in
Chart 25, fuel prices have generally been in a rising trend since 1999 and non-fuel prices since 2001—both trends interrupted temporarily by the financial crisis.
Setting to one side the near-term effects of geopolitical developments, the rapid urbanization and industrialization of nations such as China and India could be generating an ongoing secular rise in commodity prices that might not be fully captured in today's spot and futures market prices. If so, this would undercut the role of core inflation as a good predictor of future headline inflation.
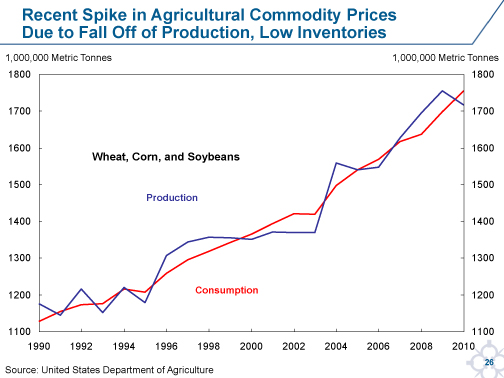
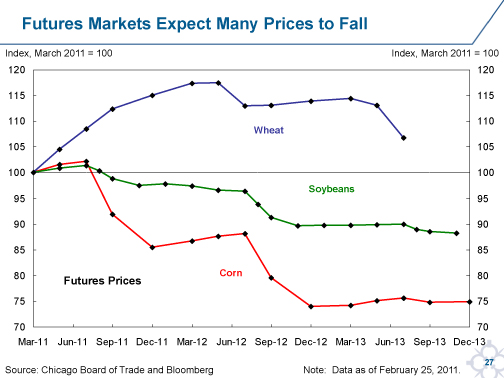
Nevertheless, there are important mitigating factors that suggest that it would be unwise for the Federal Reserve to over-react to recent commodity price pressures. First, despite the general uptrend, some of the recent commodity price pressures are likely to be temporary. In particular, much of the most recent rise in food prices is due to a sharp drop in production caused by poor weather rather than a surge in consumption (Chart 26). More typical weather and higher prices should generate a rise in production that should push prices somewhat lower. This is certainly what is anticipated by market participants, as shown in Chart 27.
Second, even if commodity price pressures were to prove persistent, the U.S. situation differs markedly from that of many other countries. Relative to most other major economies, the U.S. inflation rate is lower and the amount of slack much greater.
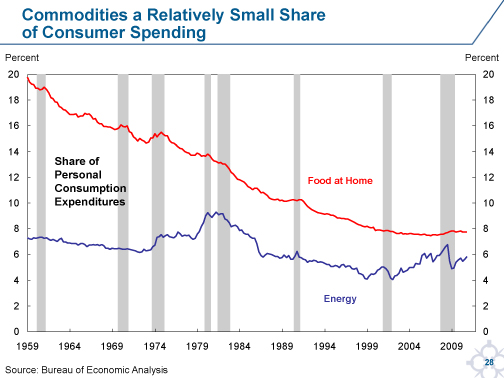
Moreover, for the United States, commodities represent a relatively small share of the consumption basket (Chart 28). This small share helps to explain why the pass-through of commodity prices into core measures of inflation has been very low in the United States for several decades.
Third, the Federal Reserve's success in anchoring inflation expectations has also been important in limiting pass-through. Since 1984, for example, when the Federal Reserve began to achieve success in driving down and then subsequently anchoring long-term inflation expectations, there has been very little evidence of commodity price pass-through into core inflation. In contrast, prior to 1984, when inflation expectations were much less well-anchored, pass-through did occur and, at times, played an important role in pushing underlying inflation higher.
This leads to our final issue—the importance of inflation expectations in shaping the inflation outlook.
Rising inflation expectations tends to push up inflation in a number of ways—by reducing the expected cost of borrowing at a given level of interest rates, by pulling forward buying decisions to beat future expected price increases, and by encouraging more aggressive price and wage setting behavior. In a world of unanchored inflation expectations, commodity price pressures would more easily be passed through into core inflation.
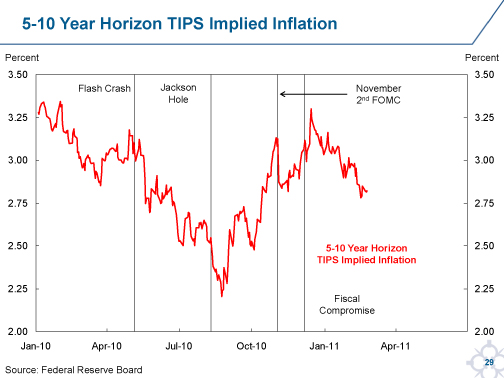
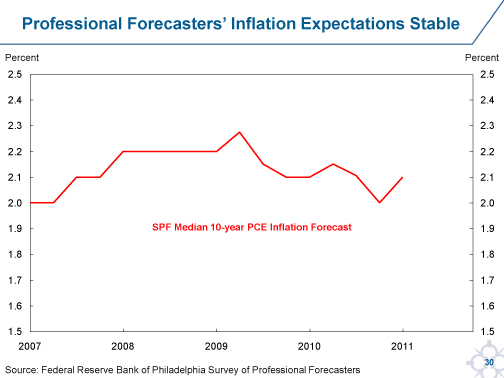
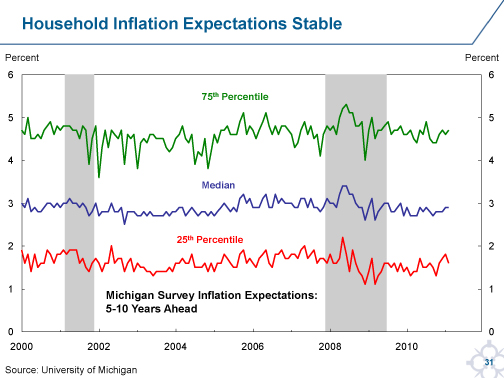
Fortunately, inflation expectations remain well-anchored. This can be seen in all three major measures of inflation expectations. First, market-based measures of inflation expectations are generally well-behaved. For example, the five-year forward measure of breakeven inflation generated from differences in the nominal Treasury yield curve and the TIPS yield curve has shown a modest rise since mid-2010 back into the range that has generally been in place for the past decade (Chart 29). Second, the long-term inflation expectations of professional forecasters have been very stable. As shown in Chart 30, the median long-term inflation forecast in the Professional Forecasters' survey remains around 2.1 percent for the PCE deflator. In terms of household expectations, there has been an increase in short-term expectations. This typically occurs when commodities such as gasoline go up sharply in price. However, even here longer-term expectations remain well-anchored. As shown in Chart 31, the University of Michigan median five-year inflation expectations measure remains around 2.9 percent—comfortably within its normal range and historically consistent with slightly lower realized inflation.
To summarize the main points, we have a considerable amount of slack, little evidence of discontinuous speed limit effects, and little inflation pass-through from commodities into core inflation when inflation expectations are well-anchored, which is currently the case. This suggests that the biggest risk in terms of higher underlying inflation over the next year or two is that inflation expectations could become unanchored. This might occur, for example, if there were a loss of confidence in the ability and/or willingness of the Federal Reserve to tighten monetary policy in a timely way in order to keep inflation in check.
In this regard, the proof of the pudding will be in our actions—talk is cheap. What is key—that the appropriate policy steps are taken in a timely manner.
However, let me make two points. First, I am very confident that the enlarged Federal Reserve balance sheet will not compromise our ability to tighten monetary policy when needed consistent with our dual mandate goals. Second, I am equally confident that no one on the FOMC is willing to countenance a sustained rise in either inflation expectations or inflation.
Let me explain why our enlarged balance sheet does not compromise our ability to tighten monetary policy. Although our enlarged balance sheet has led to a sharp rise in excess reserves in the banking system, this has the potential to spur inflation only if banks lend out these reserves in a manner that generates a rapid expansion of credit and an associated sharp rise in economic activity. The ability of the Federal Reserve to pay interest on excess reserves (IOER) provides a means to prevent such excessive credit growth.
Because the Federal Reserve is the safest of counterparties, the IOER rate is effectively the risk-free rate. By raising that rate, the Federal Reserve can raise the cost of credit more generally. That is because banks will not lend at rates below the IOER rate when they can instead hold their excess reserves on deposit with the Fed and earn that risk-free rate. In this way, the Federal Reserve can drive up the rate at which banks are willing to lend to more risky borrowers, restraining the demand for credit and preventing credit from growing sufficiently rapidly to fuel an inflationary spiral.
For this dynamic to work correctly, the Federal Reserve needs to set an IOER rate consistent with the amount of required reserves, money supply and credit outstanding needed to achieve its dual mandate of full employment and price stability. If the demand for credit were to exceed what was appropriate, the Federal Reserve would raise the IOER rate—pushing up the federal funds rate and other short term rates—to tighten broader financial conditions and reduce demand.2 If the demand for credit were insufficient to push the economy to full employment, then the Federal Reserve would reduce the IOER rate—pushing down the fed funds rate and other short term rates—to ease financial conditions and support demand, recognizing that the IOER rate cannot fall below zero. While the mechanism is different, the basic approach is very similar to the way the Federal Reserve has behaved historically.
Although our ability to pay interest on excess reserves is sufficient to retain control of monetary policy, it is not bad policy to have both a “belt and suspenders” in place. As a result, we have developed means of draining reserves to provide reassurance that we will not—under any circumstance—lose control of monetary policy. These include reverse repo transactions with dealers and other counterparties, auctions of term deposits for banks, or securities sales from the Fed's portfolio.
A related concern is whether the Federal Reserve will be able to act sufficiently fast once it determines that it is time to raise the IOER. This concern reflects the view that the excess reserves sitting on banks' balance sheets are essentially “dry tinder” that could quickly fuel excessive credit creation and put the Fed behind the curve in tightening monetary policy.
In terms of imagery, this concern seems compelling—the banks sitting on piles of money that could be used to extend credit on a moment's notice. However, this reasoning ignores a very important point. Banks have always had the ability to expand credit whenever they like. They didn't need a pile of “dry tinder” in the form of excess reserves to do so. That is because the Federal Reserve's standard operating procedure for several decades has been a commitment to supply sufficient reserves to keep the fed funds rate at its target. If banks wanted to expand credit that would drive up the demand for reserves, the Fed would automatically meet that demand by supplying additional reserves as needed to maintain the fed funds rate at its target rate. In terms of the ability to expand credit rapidly, it makes no difference whether the banks have lots of excess reserves on their own balance sheets or can source whatever reserves they need from the fed funds market at the fed funds rate.3
So we have the means to tighten monetary policy when the time comes, but do we have the will? I think there should be no doubt about this. It is well understood among all the members of the FOMC that allowing inflation to gain a foothold is a losing game with large costs and few, if any, benefits.
In this regard, some have argued that Fed officials might be reluctant to raise short-term rates because such increases would squeeze the net interest margin on the Fed's System Open Market Account (SOMA) portfolio. Although it is true that a rise in short-term interest rates would reduce the Fed's net income from the extraordinary high levels seen in 2009 and 2010,4 this will not play a significant role in the Fed's monetary policy deliberations.
Fed policy is driven by the objectives set out in the dual mandate, and the net income earned by the Fed is the consequence of the policy choices that advance those objectives. The Federal Reserve's net income statement does not drive or constrain our policy actions. In short, we act as a central bank, not an investment manager.
It is also worth pointing out in passing that a failure to raise short-term interest rates at the appropriate moment based on our dual mandate objectives would also be a losing strategy with respect to net income. Inflation would climb, bond yields would rise and the Fed would ultimately be forced to raise short-term rates more aggressively, or to sell more assets at lower prices to regain control of inflation. This would almost certainly result in larger reductions in net income than a timelier exit from the current stance of monetary policy. So what does this all imply for monetary policy? First, barring a sustained period of economic growth so strong that the economy's substantial excess slack is quickly exhausted or a noteworthy rise in inflation expectations, the outlook implies that short-term interest rates are likely to remain unusually low for “an extended period.” The economy can be allowed to grow rapidly for quite some time before there is a real risk that shrinking slack will result in a rise in underlying inflation. We will learn more as we go, and, as always, should be prepared to adjust course in a timely manner if incoming information suggests a different strategy would better promote our objectives.
Second, the Federal Reserve needs to continue to communicate effectively about its objectives, the efficacy of the tools it has at its disposal to achieve those objectives, and the willingness to use these tools as necessary. This is important in order to keep inflation expectations well-anchored. If inflation expectations were to become unanchored because Federal Reserve policymakers failed to communicate clearly, this would be a self-inflicted wound that would make our pursuit of the dual mandate of full employment and price stability more difficult. If we consistently and effectively communicate our objectives and our strategies, we can avoid this outcome.
Thank you for your kind attention. I would be happy to take a few questions.
__________________________________________
1 However, growth alone will not resolve the longer-term problem of the disparity between promises made to state and local workers in terms of their public employee pension and health benefits and the resources set aside to pay for those benefits.
2 The IOER rate and the federal funds rate are likely to track each other closely in most circumstances. Banks do not have any incentive to lend reserves in the fed funds market at rates below the IOER rate, and can arbitrage away any significant price gap that emerges from the activity of non-depository institutions that can buy and sell federal funds, but cannot hold reserves at the Fed. Thus, through the IOER rate, the Federal Reserve can effectively control the fed funds rate.
3 Indeed, even the opportunity cost of making the loan is similar in both instances. A bank that has excess reserves and decides to extend credit forgoes the chance to earn the IOER on the money lent out. A bank that borrows reserves in the fed funds market in order to extend credit pays the fed funds rate in order to do so. The IOER and fed funds rate are likely to be similar.
4 As a byproduct of actions taken to combat the crisis, the Fed generated record net income in 2009 and 2010, and remitted $125 billion to Treasury. In the early phase a significant part of this income came from liquidity programs. More recently, the main contributor has been net interest on the expanded SOMA portfolio. At this juncture, SOMA continues to generate abnormally high net income. As policy eventually normalizes and the cost of financing assets via interest on excess reserves goes up, the net interest margin on the SOMA assets will return to more normal levels. However, the net interest margin is unlikely to turn negative because roughly $950 billion of assets are—and have been for many years—funded by notes and coins in circulation, on which the Fed does not pay interest.


