Thank you for the invitation to participate in today’s discussion about post-financial-crisis monetary policies.1
My remarks today will focus on the implementation of monetary policy normalization.2 The Federal Open Market Committee (FOMC) has carefully developed and articulated a clear and transparent normalization strategy and is implementing that strategy. This approach has instilled confidence—a key to maintaining market stability, which has supported the orderly functioning of the broader set of dollar money market rates that are important to policy transmission and financial conditions.3
Against this backdrop, the FOMC has increased the federal funds target rate from the 0 to ¼ percent range that had been in effect between December 2008 and December 2015, to 2 to 2 ¼ percent at its last meeting. Additionally, since late last year, when the Federal Reserve began a program to reduce its securities holdings by reinvesting principal maturities only to the extent that they exceed gradually increasing caps, the FOMC has reduced the size of the portfolio holdings from nearly $4.3 trillion to about $4.0 trillion.4 Notably, this month, the principal payments from the agency mortgage-backed securities (MBS) portfolios are below the level of the redemption caps. As a result, after nearly $2.1 trillion of agency MBS reinvestment purchases—due in large part to refinancing activity among U.S. homeowners—there will be no agency MBS reinvestments for the first time since September 2011.
In my remarks, I will first review progress on the FOMC’s program to normalize the stance of monetary policy, which so far has shown that the Federal Reserve’s monetary policy implementation framework continues to provide appropriate control over the federal funds rate and other short-term rates. I will focus on the balance sheet and discuss the drivers of the long-run balance sheet size and composition. Next, I will review the relationship between reserve levels, which fall as the portfolio declines, and short-term interest rates. Then, I will discuss the technical adjustment to the rate of interest paid on reserves (IOR), which the Federal Reserve made in June to provide greater comfort that the effective federal funds rate (EFFR) would remain within the target range set by the FOMC.5 I will discuss how this adjustment had exactly the intended effect on money market conditions, and how it has reinforced my certainty that the Federal Reserve is well positioned to maintain the public’s high confidence in its ability to appropriately control overnight interest rates.
As always, the views I will express today are mine alone and do not necessarily reflect those of the New York Fed or the Federal Reserve System.
Let’s begin by reviewing where we are in the normalization process. The Federal Reserve began its efforts to remove policy accommodation with its overnight policy rate at the zero lower bound and with a large portfolio of long-duration securities. Normalization, therefore, has two parts: increasing the overnight rate, and reducing securities holdings.
Short-Term Rate Normalization
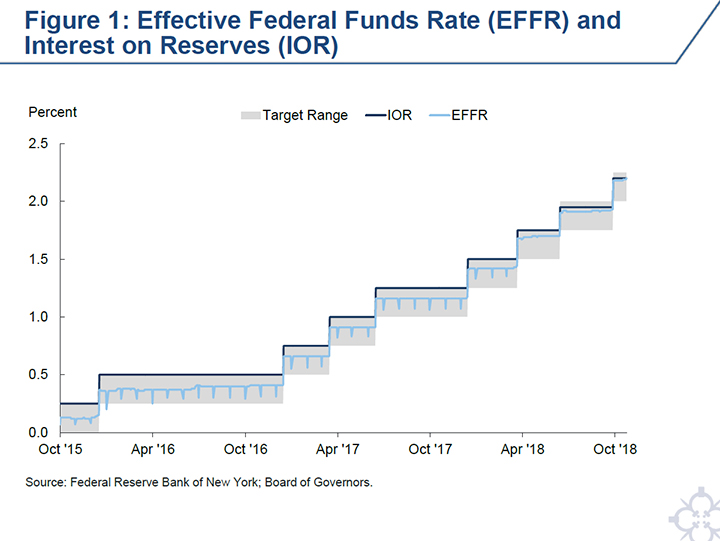
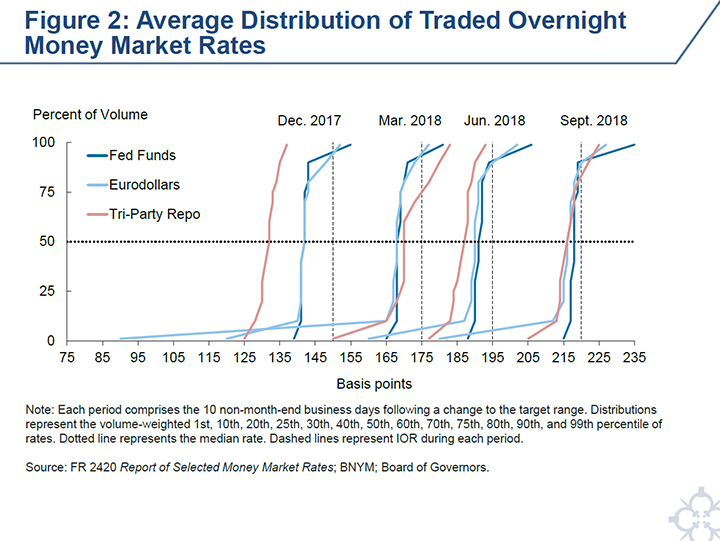
First, let’s discuss overnight rates. The current monetary policy implementation framework relies on providing the market with two overnight investment opportunities to help steer short-term interest rates: interest on reserves (IOR), which is the Federal Reserve’s main tool to control interest rates, and the overnight reverse repurchase agreement (ON RRP) facility, a secondary tool.6 This framework has proven to be extremely effective at controlling federal funds rates. As shown in Figure 1, it has maintained the EFFR within the FOMC’s target range on all but one day.7 Looking at the distribution of traded rates within both the federal funds and eurodollar funding markets, as shown in Figure 2, it is also clear that the framework has broadly fostered trading at rates well within the target range. Indeed, the difference between the 25th and 75th percentiles of the rate distribution has consistently remained very tight over the course of rate normalization.8
Of course, monetary control does not stop at the federal funds market: our framework must ensure that the stance of monetary policy is passed through into other money markets. It has also been very successful in this sense. Figure 3 shows a broad selection of secured and unsecured overnight money market rates; it is clear that increases in the target range for the federal funds rate have passed through fully and immediately to the other rates, as expected and intended.
Moreover, I have been very encouraged by the relative stability and high degree of co-movement among short-term money market rates. Figure 4 shows that the dispersion between various unsecured and secured overnight rates—another metric that could reflect the efficacy of policy pass-through—has declined and that these rates have largely converged within the upper portion of the target range since the end of last year.9 This is due, at least in part, to a large increase in the supply of Treasury bills, which supported the rise in repo rates to levels closer to unsecured rates. This also suggests that the framework continues to perform well along this dimension and perhaps is improving in effectiveness as reserve levels decline. Consistent with the broad availability of higher-yielding alternatives, ON RRP take-up remains muted, falling to a record low of $10 million in early September.10
Balance Sheet Normalization
Let me turn now to the second part of normalization: the balance sheet.11 The Federal Reserve’s balance sheet grew markedly over the past decade as a result of large-scale asset purchase programs, which were undertaken to support the economic recovery by easing financial conditions to a greater extent than could be achieved solely through reducing the federal funds rate. Starting late last year, the Federal Reserve began a program to reduce its securities holdings by reinvesting principal maturities only to the extent that they exceed gradually increasing caps.12 This gradual and predictable approach is intended to reduce the balance sheet’s size at a measured pace while supporting good market functioning and mitigating the risk of sharp or outsized asset price reactions.
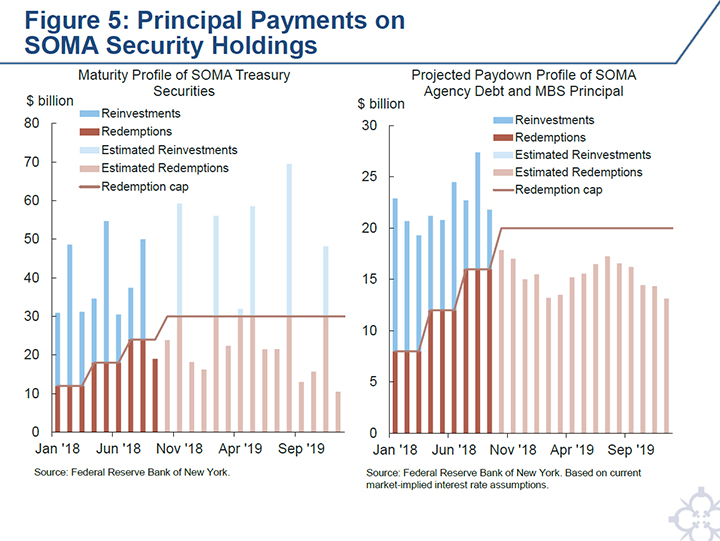
The charts in Figure 5 show the realized and estimated cash flows from the Federal Reserve’s securities portfolio. The length of the darker bars show the actual amounts of Treasury securities and agency debt and MBS principal that matured or paid down; only the amounts above the cap were reinvested. Since October 2017, the Federal Reserve’s domestic securities portfolio has decreased by nearly $300 billion to about $4.0 trillion.13
The lighter bars in Figure 5 show the projected cash flows through the end of next year. Notably, the caps reached their maximal values this month. Going forward, reinvestment of Treasury securities will nearly exclusively occur in the middle month of each quarter. As had been expected in the design of the caps, principal repayments from the agency MBS portfolio have now begun to come in below the level of the maximum cap. Consistent with the Policy Normalization Principles and Plans, when this occurs in a given month, no reinvestment occurs, and the portfolio size declines by the amount of principal repayment. In the future, mortgage principal repayments, which are sensitive to various factors, especially long-term interest rates, could conceivably rise above the level of the cap, particularly if interest rates were to decline. If this were to occur, those amounts above the cap would be reinvested. It is this cap mechanism that keeps the decline in the balance sheet at a gradual and predictable pace. The New York Fed’s Open Market Trading Desk (the Desk) will conduct operational readiness exercises during periods of no reinvestment to ensure it remains prepared to reinvest if needed.14
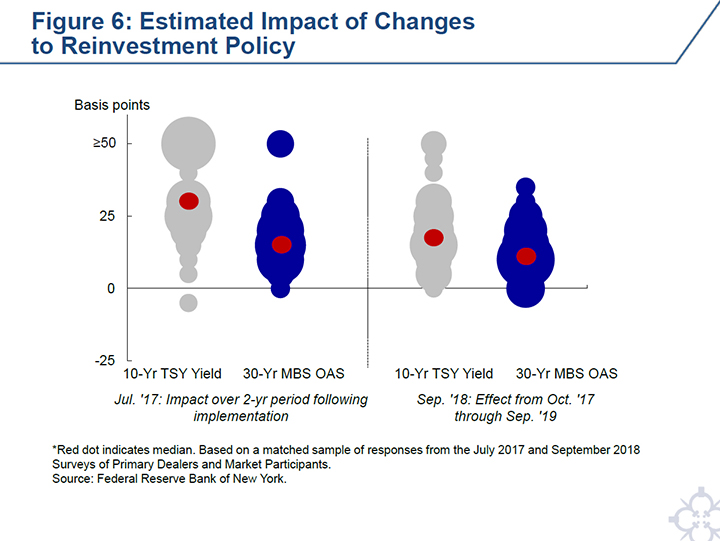
The FOMC’s approach to balance sheet normalization—and its transparency and clear communication about the normalization principles and plans prior to its implementation—was designed to mitigate the risk of sharp or outsized asset price reactions to the decline in the portfolio’s size over time. Desk surveys corroborate market commentary describing a relatively limited impact from the reduction in holdings on Treasury yields and MBS spreads thus far. As shown in Figure 6, comparing a matched sample of survey respondents in our July 2017 surveys to the September 2018 surveys, the expected impact on 10-year Treasury yields and 30-year MBS option-adjusted spreads (OAS) during the two-year period following implementation of the change to the reinvestment policy has declined, likely in part reflecting expectations for the balance sheet to normalize at a larger size.15 Looking forward, the median respondent currently anticipates the cumulative impact over the next two years to be 17 basis points for the 10-year Treasury yield, and 12 basis points for the 30-year MBS OAS.
This gradual expected increase contrasts with the experience of the so-called “taper tantrum” in 2013, which showed that markets can have outsized and sharp reactions to changes in balance sheet policy even before they happen. The expected impact of balance sheet reductions on Treasury yields and agency MBS OAS reflects the FOMC’s gradual and predictable approach to balance sheet normalization, but could also reflect additional factors. Some argue that robust credit extension by the private sector given the strong economic environment helps to offset the yield impact from a declining balance sheet. Furthermore, there are likely some spillover effects across fixed-income markets globally from asset purchase programs abroad that could affect U.S. term premia.
The Balance Sheet in the Long Run
For many years, the FOMC has indicated its intention that the Federal Reserve will, in the longer run, hold no more securities than necessary to implement monetary policy efficiently and effectively, and that it will hold primarily Treasury securities.16 Also, in the June 2017 addendum to the Policy Normalization Principles and Plans, the FOMC noted that reducing the Fed’s securities holdings will result in a declining supply of reserve balances, and that it anticipates reducing the quantity of reserve balances to a level “appreciably below that seen in recent years but larger than before the financial crisis.”
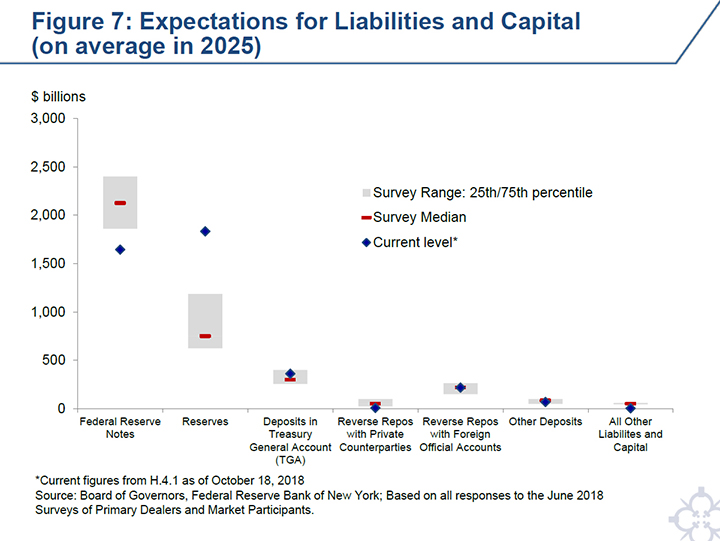
While the FOMC has articulated how the balance sheet will be reduced, there remains uncertainty about the long-run size and composition of the Federal Reserve’s balance sheet. Importantly, the size and composition will depend on growth in the various non-reserve liabilities, demand for reserve balances, and the future monetary policy implementation framework. The FOMC has not made any decisions about the long-run monetary policy implementation framework; however, the minutes from the July/August FOMC meeting suggest that the Committee will likely resume a discussion of operating frameworks in the near future.17 It is also not known how non-reserve and reserve liabilities will evolve going forward; however, our regular surveys give us a sense of how some market participants are viewing many of these components, which we show in Figure 7. In particular, the surveys ask respondents about their expectations for the size and composition of the Federal Reserve’s balance sheet, on average, in 2025, under the assumption of no return to the zero lower bound. The responses serve as a good proxy for expectations about the long-run size of the balance sheet. The median expectations are for the balance sheet to be $3.6 trillion on average in 2025 and for reserve balances to be $750 billion, or about $1 trillion below their current level.
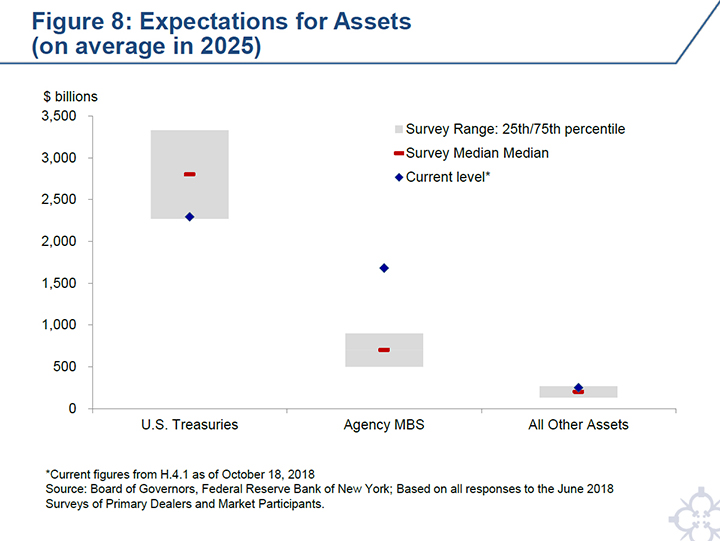
On the asset side of the balance sheet, the normalized size of the securities portfolio is one consistent with the longer-run trends in currency and other liabilities. However, even after the Fed normalizes the size of its balance sheet, the composition of its securities portfolio will not yet be “normal,” as it will not consist primarily of Treasury securities. As you can see from Figure 8, market participants expect that the domestic securities portfolio could contain roughly $700 billion in agency MBS on average in 2025.
The Dynamics Between Reserve Levels and Short-Term Rates
As the portfolio shrinks and the level of reserve balances declines, how will we know if we are transitioning from an environment characterized by abundant reserves to one characterized by scarce reserves?18 To address this question and understand how the level of reserves is related to short-term interest rates, we need to review some fundamentals. In the academic literature on monetary policy implementation, models for the behavior of the overnight interbank rate generally boil down to its relationship with the stock of bank reserves.19 These models generally find that as reserve balances decline, the overnight interest rate goes up, but not uniformly. At high levels of reserves, the responsiveness of rates to changes in reserve levels is fairly low, and the demand curve is said to be “flat.” As excess reserve levels decline, the responsiveness of rates increases. At low levels of excess reserves, the overnight rate responds sharply to small adjustments in the level of reserves, and the demand curve is considered “steep.”20
Despite some of the recent upward moves in overnight rates, I don’t believe we’ve reached the “steep” portion of the demand curve, where aggregate reserves are scarce. Let’s run through some places where evidence of aggregate reserve scarcity might be found. To begin with, if we were closing in on the “steep” part, I might expect to see substantial above-IOR lending in the unsecured overnight markets, as at least some banks each day found themselves short of reserves and had to borrow them from other banks. In fact, the current amount of such above-IOR lending remains low as a share of the overnight bank funding market, as shown in Figure 9.21 I might also expect to see shifts in bank payments behavior—for example, more daylight overdrafts or more effort by banks to “optimize” their payment flows—but I have not seen this either. Most fundamentally, I might have observed a day-to-day relationship between shifts in the stock of reserves and overnight interest rates. Figure 10 shows a scatterplot of daily changes in reserve balances against daily changes in the spread between the IOR rate and the effective federal funds rate; there is no visible relationship.
Recent experience supports my belief that we are not at the “steep” portion of the demand curve and aggregate reserve scarcity. On one day in mid-September, there was a large drop in reserves—of nearly $75 billion—as the Treasury increased its cash holdings at the Federal Reserve as a result of third-quarter tax receipts, as shown by the red point in Figure 10. As a result, reserve balances fell to one of their lowest levels in a number of years apart from quarter-ends and were close to some private-sector estimates of where reserve scarcity might appear. Based on a wide range of indicators, and as suggested by the chart, there was no evidence of reserve scarcity on an aggregate basis; indeed, based on the metric shown, rates were little changed on this day.
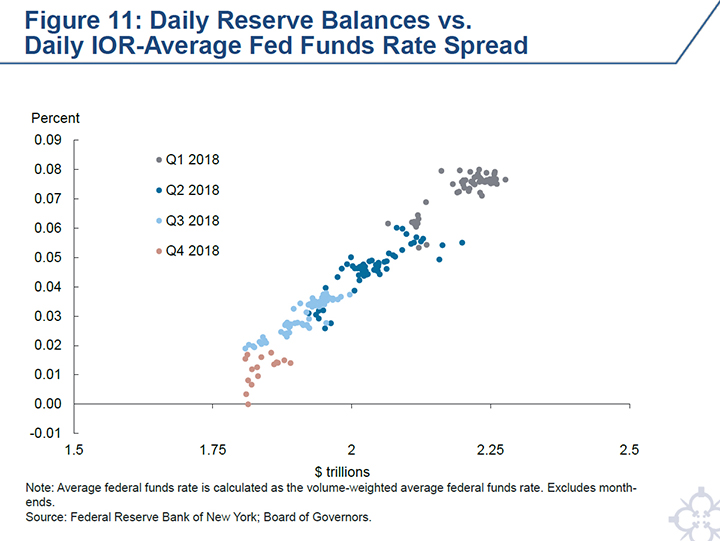
It seems highly likely that we are still on the “flat” part of the curve, where rates move little in response to shifts in reserves. However, it is still possible that the decline in reserves might be putting some upward pressure on rates. Even in the “flat” part, the slope of the demand curve, while small, might be nonzero. This could be true if, for example, the balance sheet costs of the marginal borrower in overnight money markets were upward-sloping with respect to that bank’s balance sheet size. I see this as a reasonable possibility, and therefore I think it might be possible that the decline in reserve balances has pushed up overnight rates a bit over time.22 Figure 11 provides some evidence of this dynamic; as the level of reserve balances has declined, the spread between the rate of interest paid on reserves and the volume-weighted average federal funds rate has narrowed. In addition, Figure 9 shows that as average rates in the unsecured markets have increased, trades at lower rates have declined, the whole rate distribution has shifted up toward the IOR rate, and the share of trading above the IOR rate has slightly increased. Figure 9 also reveals that the upward pressure in the federal funds market relative to that in eurodollars is more pronounced. This likely reflects unique dynamics in the federal funds market, rather than an aggregate shortage of reserves. These dynamics include banks taking into account the regulatory impact with respect to the liquidity coverage ratio (LCR) benefit when borrowing from Federal Home Loan Banks (FHLBs) in the federal funds market.23 There is also borrowing by smaller domestic banks at relatively higher federal funds rates to fund loan portfolios; these banks generally have limited access to the eurodollar market or other short-term funding sources.24
Flexibility When Needed: The Technical Adjustment
When overnight rates—including rates on federal funds transactions—edge higher, what tools does the Federal Reserve have to ensure that they generally remain within the target range when reserves are abundant? The federal funds target range is an important feature of the FOMC’s public communications, and maintaining control of the federal funds rate and other money market rates is therefore taken quite seriously. Public confidence in our ability to maintain rates within the target range is important for ensuring that expectations for the FOMC’s future policy stance are properly incorporated into the term structure of interest rates, and thereby appropriately affect financial conditions and the broader economy. At the March 2015 joint FOMC Board meeting, it was decided that in a situation of abundant reserves, the Federal Reserve intends to “adjust the IOER rate and the parameters of the ON RRP facility, and use other tools such as term operations, as necessary for appropriate monetary control, based on policymakers' assessments of the efficacy and costs of their tools.”25
Earlier this year, rates paid on the bulk of federal funds trading had ticked up, although they remained within the FOMC’s target range. The uptick in the federal funds rates raised a question as to whether the effective federal funds rate might print above the FOMC’s target range, absent a change in our operational settings.26 To address the rise in the overnight rate within the range, a technical adjustment to the IOR rate was made at the June FOMC meeting: the IOR rate was raised by 20 basis points while the FOMC raised the target range by 25 basis points. Following that change, all rates paid on federal funds borrowings, as well as in other money markets, rose by about 20 basis points. This made it less likely that the EFFR would be above the target range. At the September FOMC meeting, the IOR rate and target range were each increased by 25 basis points, maintaining the five-basis-point spread between the IOR rate and the top of the target range, as shown earlier in Figure 4.
Since the June technical adjustment, rates on federal funds transactions have continued to edge higher in the range, and most recently the EFFR has risen to the IOR rate, or five basis points below the top of the target range.27 It is possible that the EFFR could fluctuate around the IOR rate or exceed the IOR rate. However, I don’t believe that this upward pressure on the EFFR signals that we’ve reached balance sheet normalization or that we are at the “steep” portion of the reserve demand curve, where reserves are scarce. This is supported by the lack of evidence across a range of indicators signaling aggregate reserve scarcity. Let me be clear: Observing the EFFR and other rates above the IOR rate is not a sufficient condition for reserve scarcity.28 In the last few days, even amid upward pressure in overnight funding rates, we still have not seen the range of signs I described earlier that would indicate reserve scarcity, such as significant interbank volumes trading at rates above the IOR rate, increased overdraft activity, shifts in bank payments behavior, or a day-to-day relationship between shifts in the stock of reserves and overnight interest rates. As discussed earlier, the upward pressure in EFFR likely reflects the premium on borrowing from FHLBs in fed funds relative to other funding sources. In addition, it also likely reflects bargaining dynamics among banks with limited access to alternative short-term funding sources. Let me also note that the question of the appropriate longer-run balance sheet size, the point at which the Federal Reserve holds no more securities than necessary to implement monetary policy efficiently and effectively, is a related, but distinct policy judgement upon which the FOMC has made no decision as yet.
We will be monitoring that broad range of indicators to search for evidence that we’re approaching the “steep” slope—and I have confidence that our data and analytics will help us to assess this effectively.29 We have also conducted a new Federal Reserve survey specifically designed to support our efforts to obtain a high-quality estimate of where aggregate reserve scarcity might occur, and the preliminary survey results strongly support my view that reserve scarcity is some way off.30 Finally, I am confident that the Federal Reserve has the effective tools and is prepared to take measures as appropriate to ensure that short-term rates remain well-controlled and efficiently transmit the stance of policy into broader financial markets. For example, another technical adjustment to the IOR rate, as discussed in the May FOMC meeting minutes, could be used to foster trading in the federal funds market at rates well within the FOMC's target range.
Concluding Remarks
I remain highly confident that the FOMC’s framework for the normalization of the stance of monetary policy—both in the overnight market and the balance sheet—will continue to proceed smoothly, without unnecessary surprise, disruption, or volatility in financial markets. The monetary policy implementation framework continues to provide the FOMC with excellent control over overnight money market rates, and has proven to be flexible, including through the technical adjustment, in the face of new developments.
Thank you for your attention. I look forward to the panel discussion.