Thank you very much. I’m very pleased to be back at UCLA, where I enjoyed eight years in the 1990s as an assistant professor of economics. I’d like to thank my hosts for their gracious invitation to have, once again, the experience of speaking to a classroom of future leaders in finance, business, economics, and—just perhaps—central banking as well.1
Due to the large size of the Federal Reserve’s balance sheet, we are employing a new and innovative framework to control money market rates. Since late 2015, we have seen several significant developments in money markets that have tested this new framework. These include a profound reshaping of the money market fund industry as a result of new Securities and Exchange Commission (SEC) rules, significant shifts in cash management practices at the Treasury and large foreign reserve managers, and continued pressure on bank balance sheets due to the ongoing implementation of Basel III capital requirements. Also since that time, the Federal Open Market Committee (FOMC) has directed three 25 basis point increases in its target range for the federal funds rate.
Today I will discuss these structural developments, and evaluate the continued efficacy of the Federal Reserve’s policy implementation framework in light of their effects on money market competition and integration. I’ll briefly review the means by which we implement policy, and the reasons why we do so differently now from before the financial crisis. I’ll explain why changes in money market structure could conceivably impair the transmission of monetary policy. We will see that the impact of many of the recent structural developments were smoothed by the presence of the Federal Reserve’s overnight reverse repurchase facility. Then, I will take you through some data about money market dispersion to see what effect these developments had in practice.
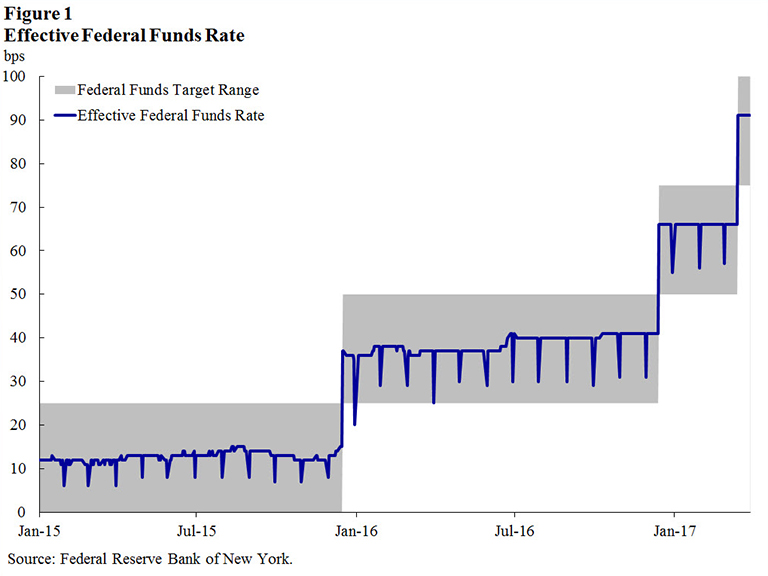
The takeaway from all this is clear: our framework remains highly effective, and has proved quite resilient, even to these significant shifts in market structure. It continues to provide the FOMC with excellent control over money market rates. Indeed, the effective federal funds rate remained within the FOMC’s target range 100 percent of the time in 2016 and this has continued so far this year, as shown in (Figure 1). Changes in the federal funds rate continue to transmit in a predictable way to other money market rates, thereby affecting, as intended, the broad financial conditions upon which the price and quantity of private sector credit depend. However, recent evidence on dispersion in overnight and term rates suggests that we should continue to monitor the transmission of the FOMC’s policy stance into money market rates carefully.
As always, these views are mine alone and do not necessarily reflect those of the New York Fed or the Federal Reserve System. My comments today are, in part, a condensed version of Domestic Open Market Operations During 2016, a report prepared by the Markets Group of the New York Fed for the FOMC. This annual report provides extensive and illuminating detail on the Federal Reserve’s operations and balance sheet. It is published as part of our mission to make monetary policy transparent and accessible to the public. The report will be published tomorrow on the New York Fed’s website and I encourage you to read it.
Our New Policy Framework: A Review
Let me start out by reviewing two basic questions: what is our framework for implementing monetary policy, and why has it changed so much?
Before the financial crisis, the Federal Reserve followed a well-worn playbook for monetary policy implementation that was based on keeping reserve balances scarce.2 Even though the Federal Reserve paid zero percent interest on reserves, banks still needed to hold small amounts of them, mainly to satisfy their reserve requirement but also for operational liquidity. The demand for reserves by banks was downward sloping (and steep). The Federal Reserve was therefore able to achieve the desired level of the federal funds rate, its policy target, by making slight adjustments in the supply of reserves in the system, so that it intersected the demand at that rate.3 On a typical day, implementing monetary policy entailed forecasting the level of reserves that would achieve the targeted level of the federal funds rate, and then, if necessary, conducting open-market operations to add or remove reserves.
Nowadays, however, reserves are no longer scarce. The supply of reserves now fluctuates widely around roughly two trillion dollars, compared to remaining tightly around ten billion dollars in mid-2007. This largely reflects the effect of the large-scale asset purchase programs, the last of which concluded in 2014, and the FOMC’s subsequent direction to maintain the size of the balance sheet by reinvesting principal repayments. Because the stock of reserves is so large, it is impractical to use open market operations to quickly reduce reserves back to the point where the federal funds rate can be controlled with scarcity, at least for now.4
Our current framework relies, instead, on providing the market with two overnight investment opportunities to help steer money market rates: interest on reserves (IOR) and the overnight reverse repurchase agreement (ON RRP) facility.5 By law, IOR is available only to depository institutions.6 Absent frictions, IOR should provide a floor on interest rates, since competition between banks that can acquire funds in the wholesale market at rates below IOR and earn the spread should bring these rates very close to that paid on reserves. In practice, a number of frictions have led money market rates to trade moderately below IOR. ON RRP, which is offered to a broad selection of counterparties that includes money market funds, is intended to intensify competition in money markets and enhance the transmission of IOR into other overnight money market rates. It also has proved useful as a shock absorber. I will get back to that in a moment.
The transmission of monetary policy relies on competition within, and integration across, money markets. The FOMC’s policy target is the federal funds rate, which is a measure of what banks pay to take out unsecured overnight loans from other banks and from government-sponsored entities. However, the Federal Reserve does not transact in the federal funds market, and therefore cannot directly impact the federal funds rate.7 Instead, it relies on a predictable relationship between rates in the markets in which it does operate, and rates on federal funds borrowings. Moreover, while the FOMC’s goals for monetary policy are maximum employment and price stability, the economic decisions of households and firms generally don’t depend directly on the federal funds rate, since they don’t participate in that market.8 Instead, their decisions depend on broader financial conditions, including the interest rates on home mortgages and corporate bonds, the performance of the stock market, and the foreign exchange value of the dollar.9 As a result, for monetary policy to achieve its objectives, markets must function well enough to transmit the stance of policy, both from the markets in which the Federal Reserve directly transacts to its policy target, and then onward from that target to other money markets, and eventually to those asset prices which directly affect real activity.
It’s helpful to think through how shocks to the structure of money markets could impair monetary control and transmission. I think about this in three steps: control of conditions within the markets in which we operate, control over the FOMC’s target—the federal funds rate, and transmission into broader financial conditions.
Some structural changes could reduce the ability of our operations to affect rates on other transactions within those same markets. For example, our ON RRP operations provide a floor on the repo rate offered by dealers to cash investors because of the competitive pressure the Fed’s offer rate places on borrowers of funds in the repo market.10 If this competitive pressure were less effective, perhaps because of greater constraints on lenders’ switching counterparties, changes in the ON RRP rate could become less effective in influencing repo market rates.
Other shocks could affect the transmission of rates from our operations to the federal funds rate. In the absence of strong financial intermediation between the federal funds market, interest on reserves, and the repo market, changes in rates the Federal Reserve controls—like the IOR rate and the ON RRP offering rate—might not affect the federal funds rate as intended. Shocks to intermediation could result in permanently weaker integration between markets. The effects could also prove temporary, for example if intermediation weakens initially but then recovers over time as market participants adjust to the shock.
Finally, changes to the federal funds rate might not affect other interest rates and asset prices that are relevant to the cost of credit in the real economy. And also, even if changes in the federal funds rate do affect those other rates, if the linkage between them were to become particularly noisy or hard to predict, it could become harder for policymakers, as well as the public, to forecast what level of the federal funds rate will best achieve maximum employment and price stability.
Recent Developments in Money Market Structure
Since 2015, my staff and I have focused on four changes in money market structure that some observers believed could have had an impact on the implementation or transmission of monetary policy. I’ll discuss each of these in turn.
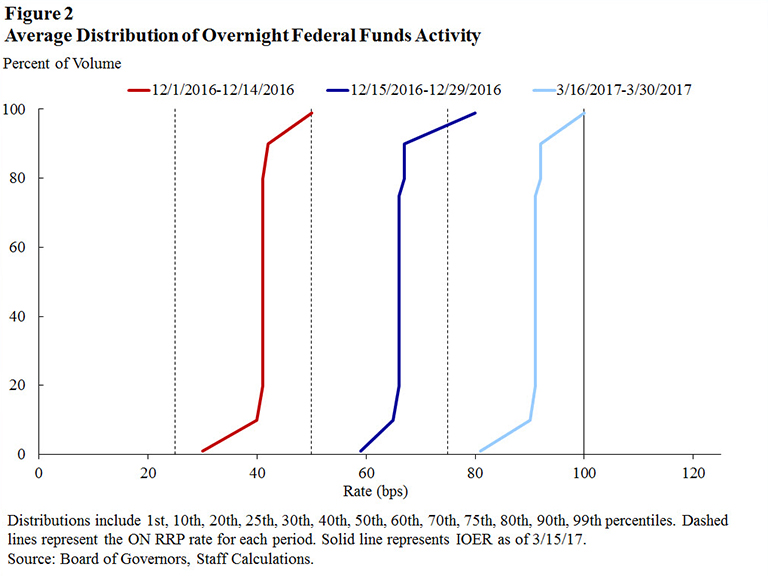
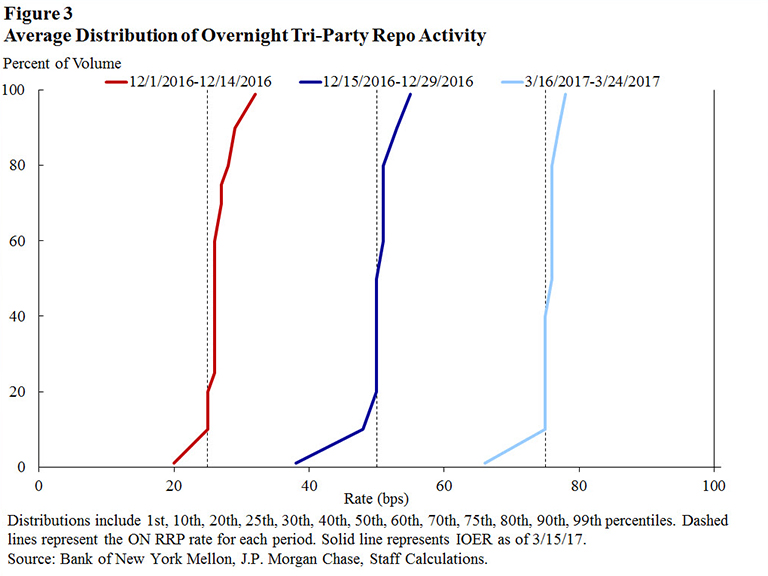
To begin with, we are now firmly off the zero lower bound. After seven years at very low levels, the federal funds rate is now trading at 91 basis points. As shown in (Figure 2), the distribution of overnight federal funds activity is now quite distant from zero, in comparison to the period before liftoff. (Figure 3) shows a similar presentation for the triparty repo market, similarly revealing that traded rates are now consistently well above the zero bound and largely above or at the ON RRP offer rate.
Certain features of the financial system likely provide support to interest rates near zero. These include the availability of physical cash and a behavioral aversion by some money market investors to investing at negative rates. They also encompass certain unique features of money markets in the United States, such as legal and regulatory incentives applicable to money market funds and the inability of the Federal Reserve to remunerate deposits held by government-sponsored enterprises.
Accordingly, when we were at the zero lower bound, we weren’t able to rule out the possibility that initial increases in the policy target might not translate one-for-one into increases in money market rates, as reduced uplift from the zero lower bound could have offset some of the policy tightening. In addition, one might have also worried that various money markets might not move together as rates rise, meaning that, for example, a larger spread might emerge between secured and unsecured rates, or between overnight and term instruments, than had historically been the case. I will discuss some evidence on these issues later on.
The second development, in October 2016, was the entry into force of new SEC rules for money market funds. These new rules require, among other things, a floating net asset value for institutional prime money market funds, provide for liquidity fees and redemption gates for prime funds, and establish more stringent rules for portfolio diversification and financial reporting for all money market funds.11 Many of these reforms are aimed at least in part at enhancing financial stability, and in particular at addressing the potential for runs on prime funds to intensify financial stress. They could also make prime funds, which can hold a broad spectrum of money market assets, less attractive to investors who desire an investment opportunity with a fixed net asset value or who are concerned about redemption fees or gates.
Our contacts in the money market fund industry could foresee, based on their own business plans and discussions with their clients, that these reforms would lead to a substantial shift in money market fund assets. Substantial amounts were expected to come out of prime funds and into government-only funds, which generally hold Treasury securities, repo against Treasury collateral, or similar ultra-low-risk assets. As a result, this reallocation was expected to bring about somewhat lower rates on Treasury bills and repo backed by Treasury collateral, and somewhat higher unsecured rates.
It is important that the monetary policy implementation framework take note of changes to the broader financial market landscape, including its regulatory structure, and adapt as necessary in response to such changes. Ahead of the reforms, our focus, which I discussed in a speech in early 2016, was on whether the reforms would have an impact on the transmission of monetary policy that might require such adaptation. In particular, we wanted to observe whether markets remained sufficiently competitive to allow for robust control of rates, and see whether the shifts in volume—particularly the anticipated upswing in demand for government-fund-eligible assets—would impair competition.12 We also wanted to see whether linkages across markets remained strong enough to ensure that policy was transmitted in accordance with the FOMC’s forecasts, especially given prime funds’ broad investment scope, and their ability to reallocate across markets according to relative value.13
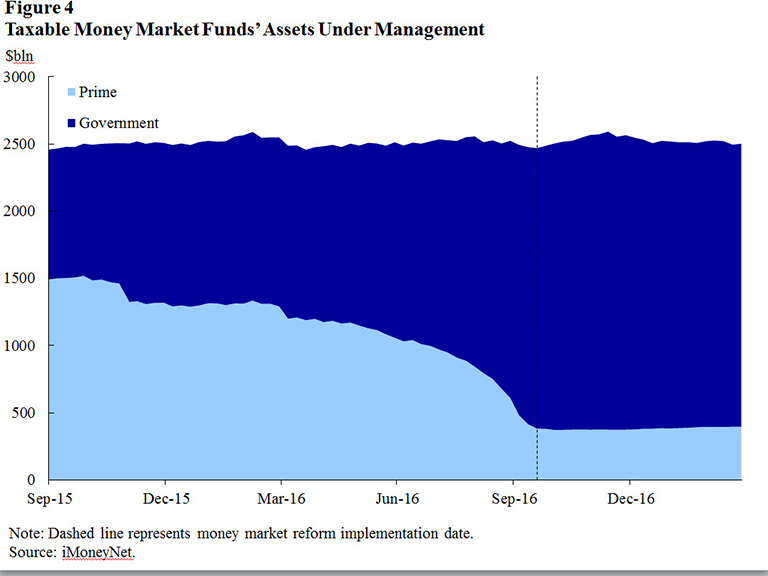
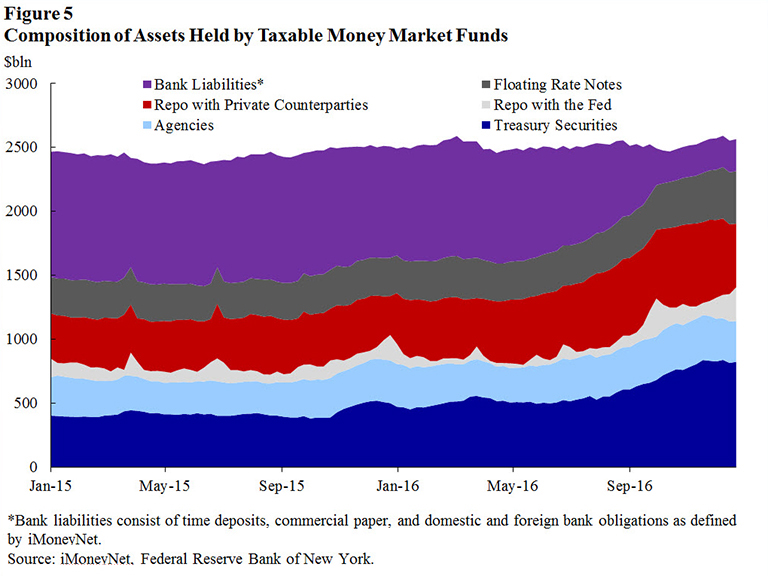
The size of the reallocation ended up being quite a bit larger than most had expected. As shown in (Figure 4), about $1 trillion of assets had migrated from prime to government funds by late 2016. This resulted in a major reallocation of the investments held by the money market fund industry, shown in (Figure 5). This reallocation had far-reaching effects on the structure of money markets, as described in a recent blog by some of my New York Fed colleagues.14 For example, banks that were relying on the funding by prime funds had to find other institutions that would be willing to lend to them. Government funds, which received large inflows, had to place the additional funds they had received, for example into Treasury or agency securities or into repo. Such a large change in funding flows could have created significant movements in money market interest rates.
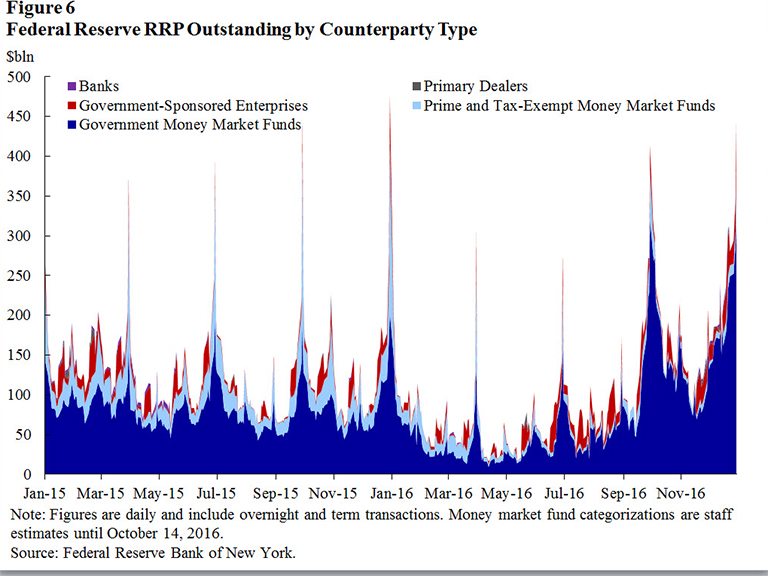
The good news is that the ON RRP facility served as a shock absorber for overnight rates. As shown in (Figure 6), money market funds, particularly government funds, increased their use of ON RRP during the transition. Because of the availability of ON RRP, government funds knew they would be able to temporarily place some of the new funding they received at the ON RRP facility while they were looking for new investment opportunities, and prime funds knew they would have access to a very secure and liquid overnight investment as they increased their liquidity to meet an uncertain level of redemptions. As a result of this elastic provision of a risk-free investment opportunity, overnight secured and unsecured rates were only modestly affected by these large flows, and overnight markets continued to move as intended following changes in the FOMC’s target for the federal funds rate. That said, the runoff in prime fund assets did leave an imprint on term unsecured rates, although some of this has retraced recently as markets have adapted. I will return to this later.
Third, for some time now we have been keenly focused on the impact on the structure of money markets that ensues from higher balance sheet costs for financial institutions.15
When I refer to balance sheet costs, I mean costs that are primarily related to the size, but not the composition, of a financial institution’s balance sheets. One example of such a cost is the leverage ratio, which is a requirement that a bank has, at minimum, capital of certain percentage of its overall assets.16
The leverage ratio was introduced as a simple non-risk-based backstop to the risk-based capital requirements and sets an amount of required capital that depends exclusively on the size of the balance sheet, plus off-balance sheet exposures for the largest U.S. banks, and does not depend on the composition of the balance sheet or the risk of those exposures. The use of explicit, numerical minimum leverage ratios as part of the capital regulation of insured depository institutions and bank holding companies (BHCs) and their broker-dealer subsidiaries has a long history in the United States, dating back to 1981, but in recent years the scope of their use has broadened considerably as many large broker-dealers were not subsidiaries of BHCs prior to the financial crisis.17 The U.S. intermediate holding company (IHC) operations of foreign banking organizations including their broker-dealers will also be subject to the leverage ratio requirements starting on January 1, 2018. Finally, reflecting the lessons learned during the financial crisis and recognizing that excessive leverage could be built up from off-balance-sheet exposures, the leverage exposure definition was expanded to include off-balance sheet exposures. This new leverage ratio is called the supplementary leverage ratio and applies to the largest U.S. institutions.18
Balance sheet costs tend to make it more expensive for financial institutions to act as intermediaries in money markets.19 If these costs are economically large in the context of the ultra-low-risk, ultra-low-margin world of money markets, this could operate to reduce dealers’ incentive to make markets and act as financial intermediaries, so long as the leverage ratio is the binding capital requirement relative to the risk-based capital requirement for such firms.20,21
In calculating the leverage ratio, all assets, including cash held at the central bank, are included. Because of the large outstanding stock of reserves in the system, this might have the effect of making the leverage ratio more binding for some firms. In addition, the effect of the leverage ratio is further magnified by dealers’ inability to “net” across similar transactions on a bilateral basis with different counterparties for accounting and capital purposes. Netting is generally allowed so long as the transactions have the same counterparty and settlement date.22 The “same counterparty” requirement could in theory be met via the implementation of a central counterparty (CCP). However, for several money markets that are important to the transmission of monetary policy, no CCP has been implemented to date. For example, there is still no CCP in the United States for the repo market, and there is also no CCP for foreign exchange swaps. The regulatory capital benefit from the implementation of a CCP for the repo market might be reduced by regulatory requirements for some arrangements, such as those associated with the provision of committed liquidity to the CCP. The implementation of a CCP raises other important policy issues that would need to be carefully considered.
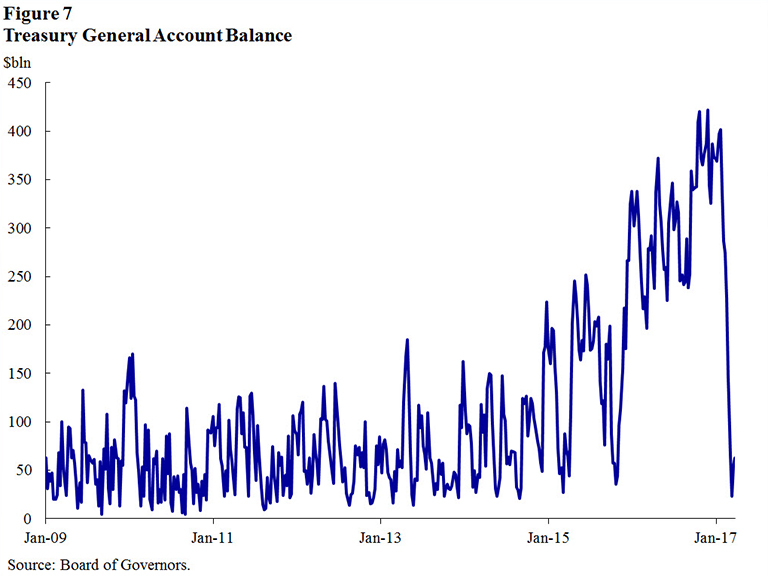
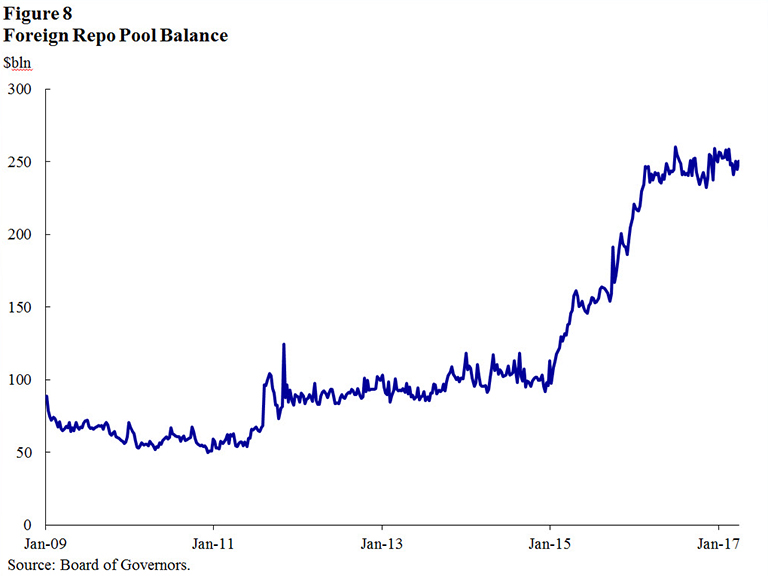
The fourth and final development: money markets have been impacted by increasingly large shifts in the Treasury’s cash management practices, as well as the cash management of a number of foreign official holders of dollar reserves. (Figure 7) and (Figure 8) show the behavior of the Treasury General Account—the Treasury’s “checking account” at the New York Fed—and balances in the New York Fed’s foreign repo pool, which is an overnight investment opportunity made available at market rates as a service to eligible foreign official and international account holders.23
Large shifts in these cash management practices can impact monetary transmission in a couple of ways. First, although we are not now conducting monetary policy via a reserves-scarcity framework, in the assessment of some analysts, changes in the stock of reserve balances still matter to pricing in money markets over a medium-term horizon.24 Largely as a result of fluctuations in these balances and in ON RRP take-up, reserves have ranged widely since the start of 2016: from as low as $1.85 trillion on January 4, 2017, to as high as $2.5 trillion on March 9, 2016.25 If the shifts in reserves are large enough, they can affect money market rates. In addition, changes in Federal Reserve balances of the Treasury and of foreign official accounts are often associated with offsetting shifts in other components of their cash management programs. For example, recent shifts in the Treasury’s cash holdings have coincided with efforts to expand the issuance of Treasury bills, and foreign reserve holders might in some cases use the foreign repo pool as a substitute for Treasury bills. Greater and more elastic supply of ultra-low-risk assets through these channels likely helped smooth out the effects of the expansion of government money market funds that I noted earlier.
Evidence of the Efficacy of Policy Transmission: Views from Duffie and Krishnamurthy
Recently, numerous academic papers have explored the functioning of money markets in the post-crisis environment, and have sought to investigate—both theoretically and empirically—how structural shifts like those I have discussed will affect the Federal Reserve’s approach to policy implementation. Darrell Duffie and Arvind Krishnamurthy presented a particularly notable empirical and theoretical study at last year’s Jackson Hole conference.26
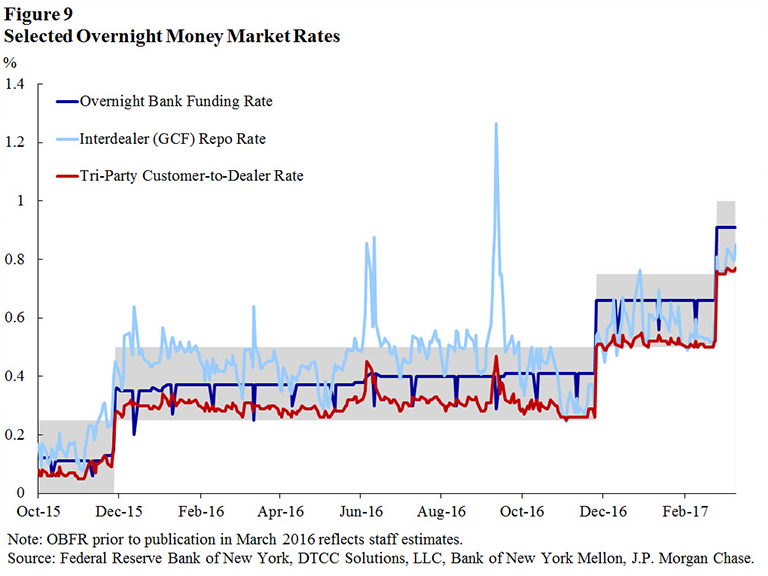
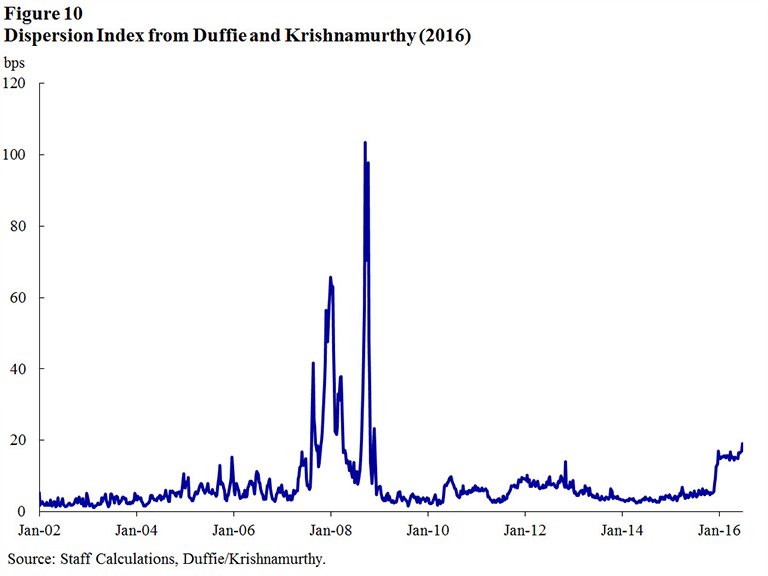
Darrell and Arvind’s central empirical observation was that money rates have become more dispersed. (Figure 9), which shows a selection of overnight money market rates, illustrates some of this dispersion. Darrell and Arvind use a broad selection of market rates, assembled from various sources and adjusted in a number of ways to make them comparable to each other, to construct what they call a “dispersion index” of money market rates, shown in (Figure 10). This series is calculated as a weighted mean absolute deviation across these rates. This metric shows that, according to their measure, dispersion across money markets has risen since late 2015, around the time the FOMC began the process of policy normalization and money market funds started to change their business models in anticipation of the new SEC rules.
Based on these data and on theoretical modeling, Darrell and Arvind conclude that monetary transmission may be less efficient than it was before the crisis. As a result, they expect that, as the FOMC increases the federal funds rate over time, other interest rates might not rise one-for-one with it. As one consequence of this, they express a concern that the Federal Reserve might see greater use of its ON RRP operations over time as monetary policy is tightened, because the rates offered on these operations—presumably rising one-for-one with changes in the target federal funds rate range—will become increasingly attractive relative to other market rates, which they expect to rise more slowly. To date, at least, this does not appear to be happening.
I think this paper makes an important point about transmission: monetary control does not stop at the effective federal funds rate, and our framework must ensure that the stance of monetary policy is passed through into other money market rates. However, I am less persuaded that the data supports Darrell and Arvind’s concern about the present efficacy of the framework.
First, I think the recent pickup in dispersion we see in money markets might not tell us much about what will happen going forward. A lot of what has happened in money markets in recent years may relate to one-off factors associated with money market fund reform and with liftoff from the zero lower bound.
Second, there are significant challenges associated with the construction of the data in the index, especially related to the measure they call “jumbo deposits.”27 Virtually the entire rise in their measure of dispersion in late 2015 comes from this one series, but this rise is largely eliminated if the series is instead constructed as done in the Organization for Economic Co-operation and Development (OECD)’s Main Economic Indicators for the United States.
Third, it isn’t obvious to me that higher or lower levels of this index correspond to “better” or “worse” monetary transmission. Absent frictions and risk premia, dispersion would be zero. In practice, there is quite a bit of dispersion. These spreads are driven by liquidity, credit, term and other fundamental risk premia that vary over time. Effective monetary transmission does not require zero dispersion—instead, it requires that market rates respond appropriately to changes in the federal funds rate, and that the relationships among market rates be reasonably predictable. Put another way: if some change in market structure causes rates across markets to be more dispersed, but every traded rate within each money market moves up by exactly 25 basis points following a 25 basis point increase in the federal funds rate, is transmission really worse than it was before the structural change?
Finally, if we are to use dispersion as a yardstick for the efficacy of monetary policy implementation, we should make use of individual transaction-level data to see how effective our tools are at uniformly affecting traded rates within each money market. Because transaction-level data are not publicly available, Darrell and Arvind’s index is based on “average” or “market” rates for each asset class. This means that they can assess only dispersion across money markets, rather than both across them and within them.
Evaluating Efficacy using Transaction Level Data
In my view, the difference between dispersion within markets, and dispersion across markets, is revealing about the nature of underlying changes in money markets. If competition were to become impaired, I might expect to see greater dispersion in rates within each individual market, as the decline in competition might allow for greater market power by individual borrowers and lenders, and therefore permit more price discrimination. In contrast, if intermediation were to be impaired, I would expect to see higher dispersion across money market rates, and more variable dispersion over time, even for very similar investments. This is because impairments to intermediation could result in greater market segmentation.
Of course, such changes in dispersion either within or across markets could also result from other changes, such as movements in risk premia. One way of reducing the impact of movements in risk premia is to focus on overnight transactions only. This has the further advantage of not requiring a complex adjustment to term rates to take account of market expectations for changes in overnight rates.
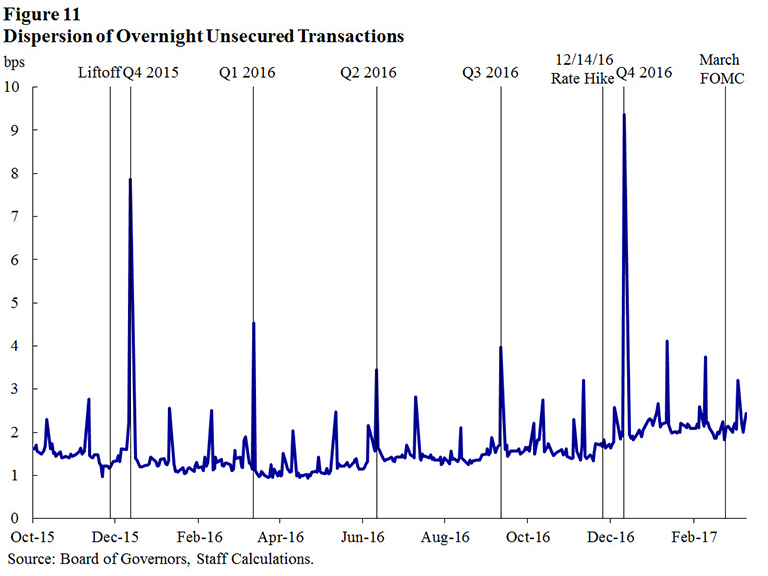
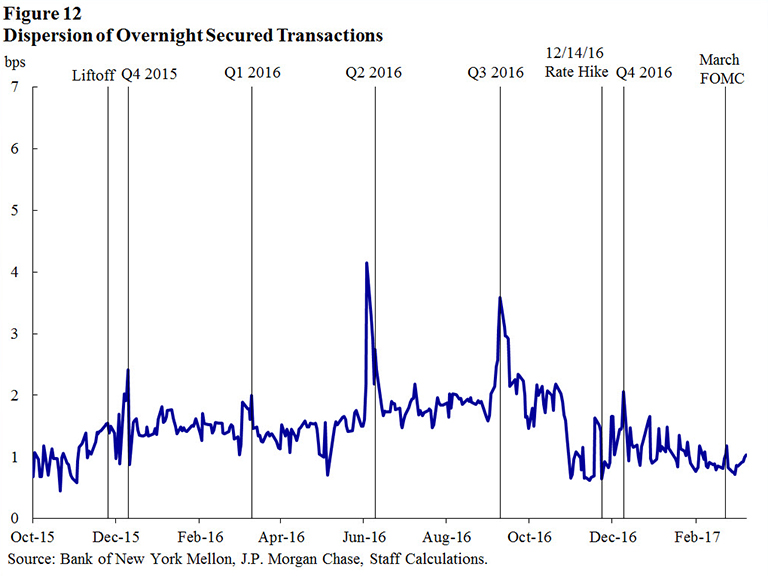
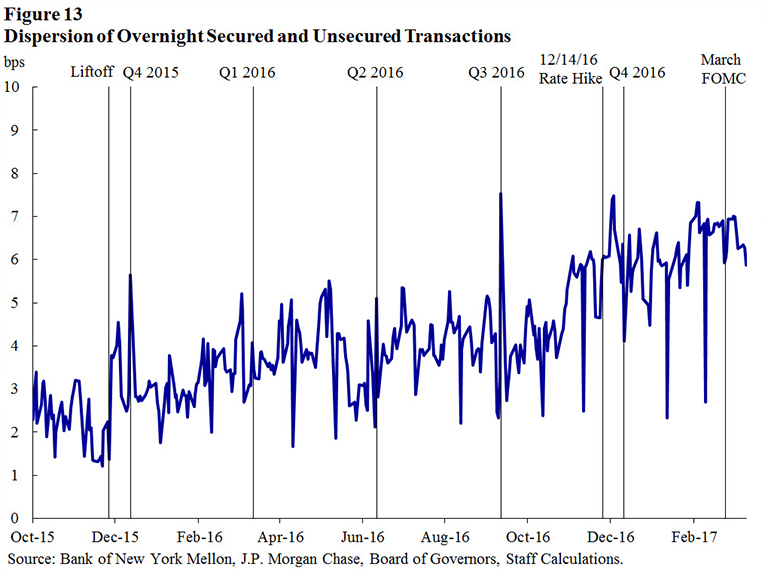
To get a sense for dispersion within money markets, we can use overnight transaction-level data in the unsecured market (federal funds and Eurodollars) collected by the Federal Reserve on form FR 2420, and in the customer-to-dealer triparty repo market collected from the triparty clearing banks. (Figure 11) and (Figure 12) show dispersion indices for activity within each of these markets, calculated the same way as done by Darrell and Arvind. (Figure 13) combines all this activity into a single combined transaction level dispersion index.
When I look at these figures, I see three things.
First, I don’t see a pronounced move upward in dispersion within either the secured or unsecured markets individually, either in general or around FOMC meetings at which monetary policy was tightened. This suggests to me that recent increases in the federal funds rate have passed through, immediately and one-for-one, to virtually all activity in these markets.
In fact, within the secured market, we see dispersion ticking down. This appears to relate to the general decline in secured rates after money market fund reform, which caused trading in the repo market to become more concentrated at or around the ON RRP offered rate. Interestingly, there is a small amount of trading in the repo market that takes place slightly below the ON RRP offered rate; this largely reflects lending by firms that are not New York Fed counterparties and therefore cannot participate in our operations.
Second, within each market, I see periodic, transitory jumps in dispersion. In the unsecured market, these typically occur on month- and quarter-end dates.28 We don’t typically observe this pattern in the customer-to-dealer repo market, but did see a spike in dispersion on June 24, 2016, the day after voters in the United Kingdom chose to leave the European Union.29 This spike might reflect the pricing-in, for a brief moment, of a modest increase in counterparty-level risk related to this development.
These shifts in unsecured market activity around period-end dates are consistent with the incentive provided by the leverage ratio requirement. The frequency of the leverage exposure calculation differs by jurisdiction: the U.S. and UK require a daily or weekly average calculation for on-balance-sheet exposures for their supervised banks, while some other jurisdictions only require a quarter-end calculation or average of the three month ends within the quarter. As discussed earlier, the leverage ratio requirements in the U.S. apply to insured depository institutions, BHCs and IHCs operations of foreign banking organizations. While these period-end approaches may be less administratively burdensome to implement than daily or weekly averages, they can incentivize firms to temporarily adjust their balance sheets around quarter-end to report higher ratios: balance sheet growth incurs no cost on most days, but incurs a significant capital cost on one or three days a quarter. Much activity in unsecured markets is low-margin intermediation in which banks borrow funds from non-banks and deposit them at the Federal Reserve to earn IOR; this activity can be less economic for leverage-ratio-constrained foreign banks on the few days when the ratio is calculated.
Third, since liftoff in December 2015, I see a modest and gradual uptick in dispersion in the index that combines both secured and unsecured markets. This increase seems to have occurred in two stages: once at liftoff, and again in autumn 2016. In contrast, there was nearly no change in dispersion following the FOMC’s two additional policy rate increases in December 2016 and March 2017. This rise in dispersion in the combined measure reflects the fact that the spread between unsecured and secured overnight rates rose around those times.
Much of the fairly modest pick-up in that rate spread seems tied to individual, one-off factors. To begin with, the dispersion in money market rates was compressed to some extent by the zero lower bound, and as rates moved into positive territory, they were able to “unpack” to an extent. In addition, at liftoff, the FOMC decided to widen the spread between IOR and the ON RRP offered rate by 5 basis points, which acted to slightly reduce secured rates relative to unsecured rates.30 These two factors explain why dispersion rose around the first tightening, but not at the following two tightenings: reduced uplift from the zero lower bound and the lower relative setting of the ON RRP offered rate had some effect on the outcome of the first tightening, but had no effect on the subsequent two. Finally, the new SEC money market fund rules brought about a pickup in demand for ultra-low-risk investments, and a corresponding decline in demand for unsecured investments. If these one-off factors were the primary reasons that this spread widened, we would expect to see essentially one-for-one passthrough of future monetary tightening into both markets.
Transmission to Broader Money Markets
This evidence on control and transmission is encouraging. However, there have been some recent signs of more volatile transmission of interest rates into broader money markets.
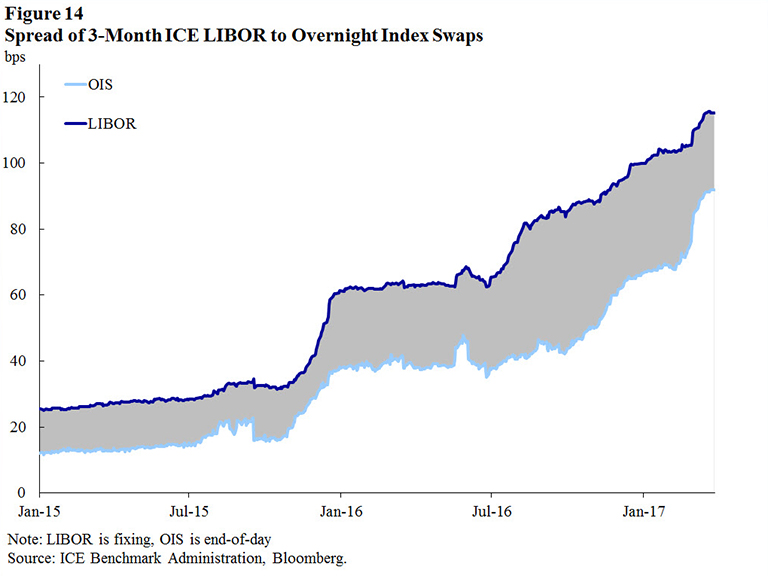
The most notable of these has been the rise in LIBOR rates relative to like-maturity overnight index swaps, shown for a 3-month maturity in (Figure 14). This figure suggests that banks’ cost to obtain funding for three months has risen relative to the cost of borrowing that funding overnight—for example in the federal funds or Eurodollar market—and hedging the overnight interest rate risk of such borrowing with a swap. During the financial crisis, this spread rose and fell with changes in investors’ perception of bank credit risk. In contrast, its recent moves are related to money market fund reform: term rates rose considerably as prime money market funds both shrunk in size and reduced their maturities to remain highly liquid, and have recently come back a bit as the market has stabilized and markets have adapted to the new industry structure.
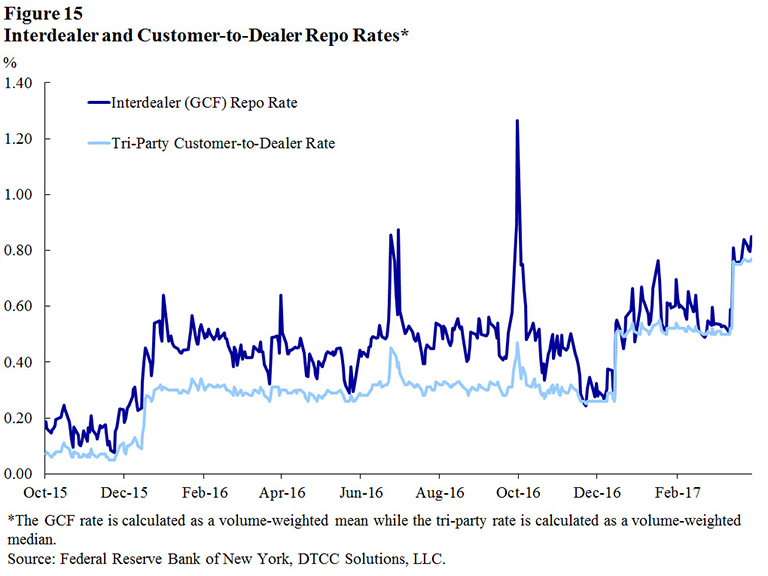
Shown in (Figure 15) are customer-to-dealer versus dealer-to-dealer Treasury repo rates. The customer-to-dealer market consists primarily of cash investors like money market funds lending to dealers, while the dealer-to-dealer market reflects dealers lending amongst themselves.31 The spread between these two rates is thus a proxy for the cost dealers with ready access to cash-investor financing charge to act as intermediaries between these two markets. Since all the lending is secured by Treasuries, this intermediation entails very modest risk.
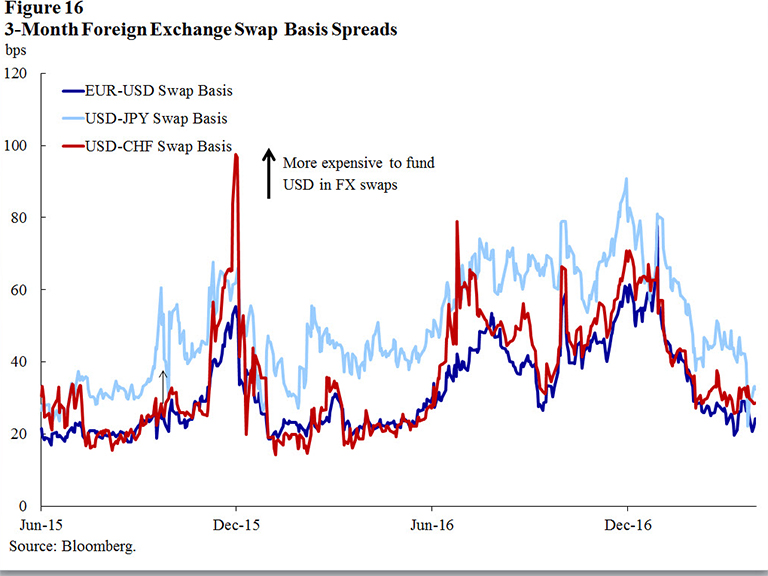
U.S. versus currency-hedged 3-month interest rates, as reflected by foreign exchange basis swaps, are shown in (Figure 16). U.S. and foreign money markets are linked together by a dealer-intermediated foreign exchange derivatives market, which allows firms to essentially convert money market loans and borrowings from one currency into another. A dealer that intermediates this spread can be thought of conceptually as making a secured loan, in which it lends out dollars and takes in foreign currency cash as collateral. Such a transaction entails modest risk.32As I’ve mentioned, a certain amount of dispersion across markets is normal and to be expected, due to liquidity, credit and other types of risk premia.33 Spreads have also declined considerably in recent months. This could be due to the market adapting to the changes I have described. However, the data indicate that spreads have become more variable, have increased to high values at times, and in the case of repo and foreign exchange swaps have become especially volatile around month-end, and, especially, quarter-end dates.
The increase in spreads in the repo and FX swap markets relate to the confluence of two factors:34 constraints to intermediation ensuing from the leverage ratio pressures I mentioned earlier, combined with limited access to dollar money markets by some financial as well as non-financial institutions.35 Pressures to reduce balance sheet size at period-end dates affect domestic money market integration, and integration across different global money markets, just as they affect the link between unsecured markets and IOR that I discussed earlier. These pressures are made more acute by inelastic demand for wholesale dollar funding from some firms that hold large dollar loan and securities portfolios but lack access to dollar deposits or to direct funding from money market funds.36
Prognosis
On the whole, these shifts in broad money market spreads do not pose a problem for monetary policy formulation or implementation. Although LIBOR and some other spreads are wider, they are, on average over time, generally stable and slow-moving, and as a result forecasters are able to incorporate any effect these spreads might have when formulating their projections for monetary policy. Changes in the policy rate continue to be passed through predictably into all these markets, as recently observed. Transitory, predictable and non-disruptive increases in period-end volatility are unlikely to meaningfully affect the real economy. And finally, there is evidence that the wider spreads among market rates that came out of money market fund reform are gradually closing over time, as firms adapt to the new structure of money markets by adjusting their portfolios and identifying new counterparties.
However, if market dispersion were to increase too much, this could cause a variety of challenges. Such dispersion could affect monetary transmission, altering the price of credit made available to certain borrowers. This could complicate the formulation of monetary policy if it were to become harder for policymakers to anticipate the impact on the economy that would ensue from future changes to the federal funds rate. Such dispersion could also affect the use of our operations.37
As I have noted, it seems that much of the recent shift in money market dispersion has arisen as a byproduct of important regulatory improvements to improve the safety and soundness of the global financial system. Money market fund reform is now in place, and while the leverage ratio and many other Basel III rules are not fully in force, in practice most banks are complying with them. As a result, what we have observed in money markets might simply have reflected a one-off realignment of asset prices to the new enhanced regulatory structure.
Conclusion
To conclude: I continue to be greatly encouraged by the performance of our framework for policy implementation, which has provided the FOMC with excellent control over the federal funds rate and predictable pass-through of the monetary policy stance into broader money market conditions. Transaction-level dispersion measures demonstrate markets that are competitive, and suggest that the effects of policy tightening are realized as expected and intended. These markets, and our framework, have proved resilient to major shocks to the structure of money markets, including the reshaping of the money market fund industry.
I remain highly confident that our framework will continue to perform very well. Nevertheless, we should continue to monitor the possibility of a growth in dispersion in broader money market rates. Gathering more and better data about money markets is a useful step in this direction, and one at which my colleagues and I are actively engaged. Learning more about policy transmission through theoretical and empirical modeling is another useful endeavor.
As stated in a recent Bank for International Settlements report, “Financial regulation aims to influence the behavior of banks and other financial intermediaries to enhance their resilience and support financial stability. Given that those same intermediaries interact with central banks in the context of monetary policy implementation, changes to the regulatory environment are bound to have effects that central banks will need to take into account.”38 Economic and financial stability are closely interconnected; for example, monetary transmission was reliably effective in 2007, but in 2008 became quite impaired as a result of systemic financial stress. In navigating these issues, my colleagues and I are aided by the integration of policy analysis across disciplines at the Federal Reserve System, an arrangement which provides an ongoing breadth and depth of perspective.
Thank you for your attention.