The data visualizations below are no longer being updated.
-
-

The Teller Window is a publication featuring expert knowledge and insight from the New York Fed, including thoughts and perspectives from senior leaders.

Do you have a request for information and records? Learn how to submit it.

Learn about the history of the New York Fed and central banking in the United States through articles, speeches, photos and video.
-
-
-

The Governance & Culture Reform hub is designed to foster discussion about corporate governance and the reform of culture and behavior in the financial services industry.

Need to file a report with the New York Fed? Here are all of the forms, instructions and other information related to regulatory and statistical reporting in one spot.

The New York Fed works to protect consumers as well as provides information and resources on how to avoid and report specific scams.
-
-
-

The New York Innovation Center bridges the worlds of finance, technology, and innovation and generates insights into high-value central bank-related opportunities.

The growing role of nonbank financial institutions, or NBFIs, in U.S. financial markets is a transformational trend with implications for monetary policy and financial stability.

The New York Fed offers the Central Banking Seminar and several specialized courses for central bankers and financial supervisors.
-
-
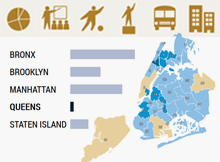
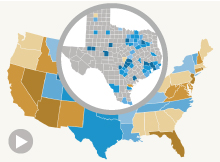
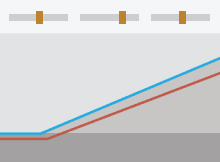
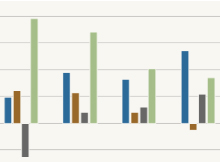
Data Visualization
At the New York Fed, we use data visualization as a communications tool. Data is both quantitative and qualitative. It can include statistics, words, pictures and sounds. Our approach to information graphics is to facilitate an understanding of the content and to let the nuances of the data come through objectively and consistently. The graphics must remain neutral, but also give the audience an ‘Aha’ moment, which illuminates the content but does not dramatize an observation. We let the data speak for itself. Below you can explore examples of interactive graphics from the New York Fed's website.
Past Projects


By continuing to use our site, you agree to our Terms of Use and Privacy Statement. You can learn more about how we use cookies by reviewing our Privacy Statement. 
