It is a pleasure to deliver the lunchtime address during the Atlanta and New York Fed's first annual research day on quantitative tools for monitoring macroeconomic and financial conditions.1 My remarks will focus on some insights from the book Superforecasting by Philip Tetlock and Dan Gardner, with respect to how we interpret, use, and evaluate the results from our quantitative tools.2 If you have read the book, subtitled "The Art and Science of Prediction," you will probably be aware that it is much less mathematical than the discussions we have been having today, but at the same time is more complex in how it articulates the role of forecasting in good decision-making. Before I continue, I should note that these remarks reflect my own personal views and not necessarily those of the New York Fed or the Federal Reserve System.
The insights in Superforecasting grew out of a forecasting tournament sponsored by the Intelligence Advanced Research Projects Activity (IARPA). In the wake of the controversy surrounding the intelligence community's assessment of the existence of weapons of mass destruction in Iraq, IARPA set out to enhance the accuracy, precision, and timeliness of intelligence forecasts.3 The Federal Reserve and the broader economics and financial community have, of course, had to face similarly humbling shortcomings in our failure to forecast the Great Recession, despite the numerous signals that were available to forecasters and policymakers prior to 2008. On this issue, it is useful to recall a quote from an unusual source on economic forecasting, the Queen of the United Kingdom, who in November 2008 asked, "Why did nobody notice it?" We should not treat this as a rhetorical question. What are some of the underlying reasons individuals and organizations fail to predict? What should we change about our mindsets and practices to improve the chances that we "notice it" next time, whenever that may be?
At the New York Fed, we've made investments in response to these critical questions. We've created a team that is raising awareness of the challenges that make it so difficult to "notice," innovating on how we approach analysis and decision-making, and making these approaches an essential part of what it means to work at the Bank. This is much in the spirit of what IARPA sought to do by sponsoring their tournament.
To compete in the IARPA tournament, Tetlock recruited participants online from outside the intelligence community. A small number of these participants quickly separated themselves from the pack and consistently maintained their exceptional performance. Tetlock dubbed these individuals "superforecasters" and subsequently focused his team on aggregating the forecasts of these standout performers—a strategy that draws from the "wisdom of the crowd." As you well know, this strategy relies on some degree of independence in the information, approaches, and insights producing the forecasts. We often think of independence in a very statistical sense, but Superforecasting conveys a useful framing of independence as how one assembles diverse teams and how team dynamics can be established to maintain this diversity.4 This approach won the IARPA tournament by a substantial margin with the use of one subtle but important tweak. Tetlock extremized the aggregated prediction probabilities—so, for example, a probability of 70 percent became 85 percent.
So what can we learn from these non-technical superforecasters who outperformed the intelligence community? Tetlock lists a number of characteristics that generate individual diversity and maintain that diversity in a team dynamic. My quick summary of these lessons is to be humble, always question, listen to alternative views, and—very comfortingly for Bayesians like me—always express your forecast as a distribution rather than a point forecast, and crucially update that forecast when new information arrives. Further, constantly assess why forecasts worked and didn't work.
In contrast, the book is full of examples of forecasters and pundits whom Philip Tetlock refers to as hedgehogs; knowing one central truth, they take data as either affirming their views or, if not, discarding the data as unreliable, irrelevant, or uninteresting. The impact of the Great Recession has been helpful in removing some of this type of hubris, but memories are short, and Tetlock's work shows that making lasting improvements in processes that produce good judgment and decision-making requires structure and constant practice.
Much of Tetlock's message is around the importance of quantifying statements. He uses a statement by former Microsoft CEO Steve Ballmer as a prime example of a statement that requires quantification: In 2007, Ballmer said, "There is no chance that the iPhone is going to get any significant market share. No chance." Depending how we quantify "no chance" and "significant market share," Ballmer was either accurate or inaccurate. Tetlock argues convincingly that quantifying statements in a manner that allows accuracy to be objectively evaluated is a critical part of good prediction. This is clearly part of the science of prediction, and I would argue not an issue for the sophisticated tools we use to monitor and forecast in central banks.5 However, our tools are so sophisticated and so cutting-edge (as the papers presented today illustrate) that they can become their own form of hedgehog. At the recent Brookings-Yale conference looking back 10 years after the crisis, both former Federal Reserve Chairman Bernanke and Vice Chair Kohn expressed the view that too much weight was given to the predictions of the Fed's workhorse model FRB/US.6
Some of you might observe that model uncertainty is a well-developed field, and certainly staff of the Federal Reserve Board and the Reserve Banks all appreciate the importance of using a diverse set of models with different transmission mechanisms, estimation approaches, and solution methods. Further, the Great Recession has generated considerable interest in approaches that allow for nonlinear reactions and fat tails, as Marco Del Negro will explore this afternoon. While I am incredibly sympathetic to the idea that more sophisticated modeling can improve judgment and decision-making—especially as I spent much of my career working on such technical issues—this approach has limits. If one had to summarize the message of the Superforecasting book in one line, it would be the well-known quip, "Forecasting is hard, especially about the future."7
To illustrate some of the learnings from the book, I invite you to consider a standard problem: What is the probability the U.S. economy will be in a recession over some period of time? This is similar to the focus on binary outcomes in the IARPA tournaments.
One simple, wisdom-of-the-crowd-based approach to this question would be to poll you all right now given a specific time frame. Rather than disturb your lunch, we can instead consider using the wisdom of the market. Given my role in the Markets Group at the New York Fed, I'd like to focus on what financial market participants' beliefs and market prices can tell us about this question and what we should do with the answers from them.8 Let's first consider asking market participants directly and then use observed asset prices to answer the question.
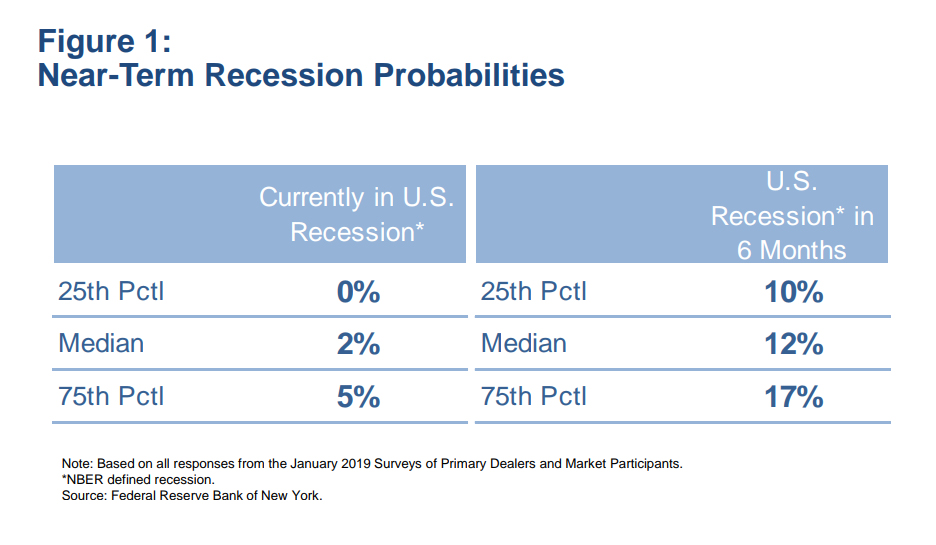
Prior to the January 2019 FOMC meeting, as part of its routine policy expectations survey, the New York Fed asked market participants to report what percent chance they attach to the U.S. economy currently being in an NBER recession, and what percent chance they attach to the U.S. economy being in an NBER recession in six months.9 We have been asking survey recipients these questions for over 10 years. As shown in Figure 1, the median respondent assigned a 2 percent probability to the U.S. currently being in a recession and a 12 percent probability to the U.S. being in a recession in six months, with a fairly small degree of dispersion around these predictions.
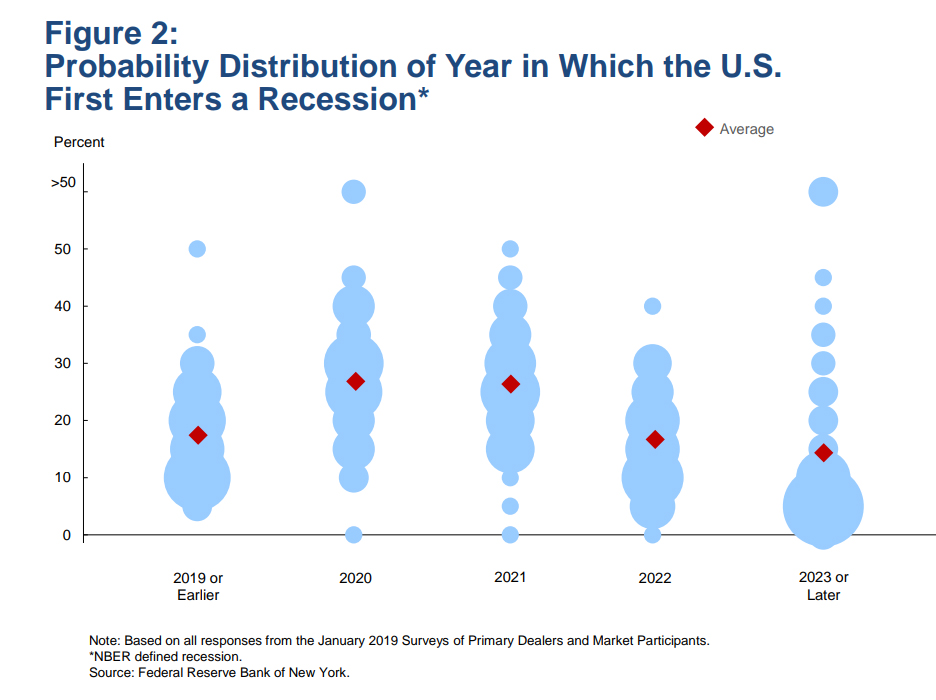
Separately, we posed a newer and more complicated question, asking respondents to provide a probability distribution of the timing at which they believe the U.S. economy will first enter a recession. The bubble chart shown in Figure 2 illustrates the range of results, with the relative size of each bubble indicating the relative number of responses for each probability. Perhaps not surprisingly, responses were much more dispersed. Respondents placed the highest probability on a U.S. recession first occurring in 2020 or 2021, assigning a roughly 25 percent probability to each, on average. At about 17 percent, the distribution's average probability of a recession starting in 2019 or earlier suggests a good match with the shorter-horizon question. Interestingly, our respondents demonstrated an ability to calibrate their probability assessments over a longer horizon, something some of Tetlock's superforecasters struggled with.
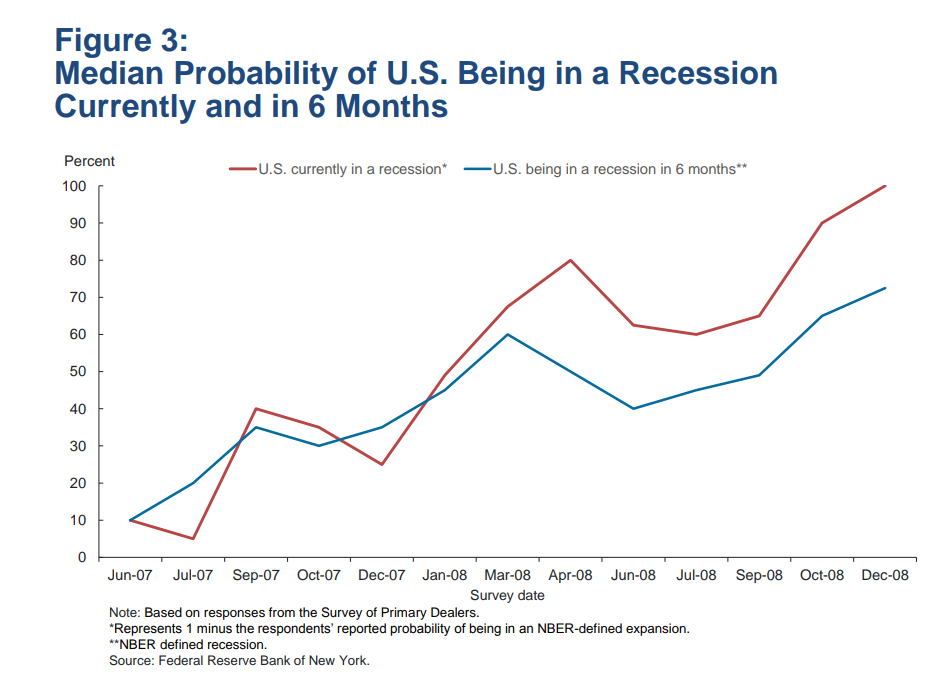
However, historical perspective may offer a cautionary tale. Figure 3 shows the evolution of results from our survey's recurring questions on the probability that the U.S. economy is currently in an NBER recession and that it will be in an NBER recession in six months, taken over the mid-2007 to late-2008 time period. This period, of course, encompasses the start of the Great Recession, which the NBER dated as beginning in December 2007. Although the probabilities in our survey responses were starting to trend upward in the second half of 2007, they remained well below 50 percent.10 You might wonder why we ask these two questions. We ask these two questions so that when the current probability of a recession is high, the probability of a recession in six months' time allows us to calculate a probability of switching to an expansion. For example, by December 2008 nearly all our respondents were sure the U.S. economy was in a recession; thus, the 70 percent probability of being in a recession in six months can be interpreted as a 30 percent probability of an expansion in June 2009. The NBER subsequently declared July 2009 as the turning point into an expansion.
Another approach to predicting recessions, which is a form of the wisdom of the crowd, is to use financial market asset prices. The well-known argument is that because large amounts of money are on the line, this different form of aggregation of diverse views will tend to be more accurate. Of course, asset prices also include compensation for risk, and much of modern asset price theory is focused on how fluctuations in this compensation drive much of the asset market volatility we observe. In the technical language of modern asset price theory, the probabilities from our surveys are physical ones, whereas those that use asset prices without adjustment for risk aversion are risk neutral probabilities.
The classic variable to use here is the term spread, the difference between a long-term interest rate and short-term interest rate. The seminal paper showing the power of the term spread to predict recessions, measured as the 10-year Treasury rate less the three-month rate is by Arturo Estrella and Rick Mishkin. The paper, written while they were both working in the New York Fed's Research Group in the mid-1990s, formed the basis of many internal discussions in 1999-2000 and 2006-2007 as the U.S. yield curve inverted.11 Much of the internal discussion was around trying to understand whether the properties of the yield curve were different. The current estimate from this model is a 23.6 percent chance that the U.S. economy will be in an NBER-defined recession in January 2020.
Just like Tetlock, Arturo liked to extremize the results of the model, so for example a probability of at or above 30 percent is moved to 100 percent and below 30 percent is moved to zero. One reason to extremize the results is that the prediction object is a recession in one particular month, rather than the probability of a recession over a period of time. Marcelle Chauvet and I analyzed this more general problem.12 Our goal was to avoid the problem with the probit model that a constant forecast of, for example, a 25 percent probability that the economy will be in recession in 12 months' time implying after one year of such monthly predictions a 97 percent probability the economy would be in a recession in at least one month of the 12. This is similar to the issue I mentioned earlier, where some of the superforecasters appear to have had difficulty calibrating their probability assessments over varying time horizons. Such a poor calibration would run afoul of the Brier-based scoring system used in the IARPA tournament.13 It is clear that extremizing the results lessens the impact of the poor calibration on the scoring system, but it leaves open the question of whether a better calibration is possible.
Another financial market indicator we could look at is the stock market. As Paul Samuelson famously stated, the stock market has predicted nine of the last five recessions. An alternative statement—and this is also true of yield curve inversions—is that no U.S. recession has occurred since the Second World War without a yield curve inversion or stock market correction (or worse) proceeding it. As a recent San Francisco Fed Economic Letter carefully illustrated, yield curve inversions have the additional record of indicating only one false positive in the U.S., during the mid-1960s.14
If we cared equally about forecasting recessions and expansions, these properties would be well-reflected in the Brier score; however, if we view recessions—or more accurately, elevated probabilities of a recession—as more concerning than elevated probabilities of an expansion, then Brier scoring is not sufficient. As Tetlock writes, "One problem is that Brier scores treat false alarms the same as misses." The issue of asymmetric loss functions over outcomes is well understood by economists, and more recent research around robustness to ambiguity in probability assessments provides more formal methods of "extremizing" probabilities based on loss functions and the level of ambiguity.15
Another issue Tetlock raises is that prediction of binary outcomes of clearly stated problems, while useful for tracking forecast accuracy and learning good technique, leaves a lot of information to still be determined. For the question I posed on the probability of a recession, we would also want to have forecasts of how moderate or deep the recession would be if it occurred. This is particularly true in the current environment of low natural rates of interest, where recessions are more likely to be associated with trips to the zero lower bound (ZLB) and the ability to further reduce the policy rate is constrained.16
A topic beyond the scope of Superforecasting—but very relevant for the forecasting of recessions—is that policy decisions given the probability assessment can affect the actual outcome. This relationship suggests that extremizing results is much more useful for forecast tournaments than in every day practice for central bankers. Further, economic outcomes can be partly determined by multiple equilibria or animal spirits, which themselves can be influenced by current decisions and communications. For example, we have heard from market contacts that FOMC participants' recent discussions of the link between yield curve inversion and recessions could encourage some economic agents to believe a recession will occur if the yield curve does invert. This brings me to the fundamental question of why a particular pattern of asset price moves tends to precede recessions. Let's suppose for now we have estimated and evaluated the best possible model to incorporate the statistical implications of these asset price patterns on recession probabilities and of the depth of a recession based on the available data. Is the model showing a causal relationship or is it just a predictive relationship with a different causal factor driving both asset prices and the real economy? And if the latter, what are the causal factors?
This is a different question than the one we were debating in our internal discussions in 1999-2000 and 2006-2007. We spent much of that time arguing about whether structural change, particularly lower compensation for interest rate risk, meant that asset price indicators were less relevant than before. An alternative approach would be to ask, if the probability of recession is elevated, what might be causing this phenomenon? And then ask the complementary question: If the probability of recession is unusually low, what might be causing that phenomenon? In this latter case, given the asymmetry in loss between elevated recession probabilities and elevated expansion probabilities, a very helpful follow-up question would have been whether beliefs in central banks contributing to the economic stability of the Great Moderation had made us too complacent about recession risks.
Tetlock emphasizes the importance of post-mortems once outcomes are known. In particular, they allow one to assess whether a forecast turned out to be accurate because of luck or because of some mechanism articulated in advance. This is critical to learning in a complex environment where feedback may be ambiguous or hidden. Without active assessment and reassessment, we're prone to hindsight bias and the belief that we will surely see it coming next time.
In the post-mortem I wrote about the failure to forecast the Great Recession, the focus was on the phenomenon and links that we failed to see or were to slow to realize the power of.17 There was nothing on the debate about whether the signal from the yield curve was misleading due to low term premia because ex-post, given the depth of the Great Recession, this debate seems a little silly. So then the question we should be asking ourselves is how could we have arrived at a clearer focus on the relevant forces before the Great Recession? What structures, processes, and behaviors should be in place to help us question our assumptions?
Institutionalizing such practices thus remains an essential challenge for our ability to monitor and forecast economic and financial conditions, and to explain their possible implications to policymakers. I'd therefore like to return to the investments we've made at the New York Fed through the Applied Critical Thinking (ACT) Function, led by my colleague Meg McConnell. ACT is dedicated to promoting awareness of how bias and complexity impede a central bank's ability to achieve its objectives, and to establishing alternative mindsets and methods to confront these challenges. One of ACT's key initiatives, inspired by the learnings in Superforecasting, is implementing a tournament at the New York Fed with the goal of giving Bank staff the opportunity to assess their use of the practices for which Tetlock advocates.
In conclusion, models and quantitative tools, like the ones we are discussing, can take us a long way. But they are designed to answer specific questions that are at best strong building blocks to the broader questions that policymakers grapple with. Being rigorous in our evaluation of these building blocks is critical, as is openness to other forms of information and approaches. The insights from Superforecasting are relevant for both the evaluation of specific tools and asking questions not addressed by these tools. Tetlock ends the book with Ten Commandments for good forecasting. However, in the spirit of being humble around forecasting problems, he adds an eleventh commandment: "Don't treat commandments as commandments." A version of this I would like to leave you with is to not treat any particular model or quantitative tool as the whole truth; no matter how sophisticated the underlying technical details may be, keep questioning assumptions about how the economy works and be always open to contradictory information, not just confirming evidence.
As a closing example of the mindset underlying this philosophy I am going to quote Warren Buffett quoting Meg McConnell: 18
- The years ahead will occasionally deliver major market declines—even panics—that will affect virtually all stocks. No one can tell you when these traumas will occur—not me, not Charlie [Munger], not economists, not the media. Meg McConnell of the New York Fed aptly described the reality of panics: "We spend a lot of time looking for systemic risk; in truth, however, it tends to find us."