Thank you, Trevor. And good morning, everyone. It is a special privilege to participate in this conference honoring my dear friend, colleague, and co-author, Thomas Laubach.
Many of you knew Thomas personally, and all of you knew him through his work. He was a brilliant economist, trusted colleague, and an inspiring leader. We miss Thomas' dedication, good cheer, and sense of humor, and his impact on everyone he touched endures.
Our collaboration started in the fall of 2000 with a shared interest in figuring out how to measure the elusive natural rate of interest, otherwise known as r-star. At the time, neither of us had any idea that our research on this topic would continue for 20 years.
Kathryn Holston and I are carrying on this work. It's one of the many ways we can honor Thomas and his memory. Because of the unprecedented, pandemic-related shocks to the economy, we paused our regular publication of r-star estimates in late 2020. This conference is the perfect venue to announce that we are resuming them. But first, I want to take some time to share r-star's origin story, which is how I came to know Thomas.
Before I go any further, I need to give the standard Fed disclaimer that the views I express today are mine alone and do not necessarily reflect those of the Federal Open Market Committee (FOMC) or others in the Federal Reserve System.
Questioning the Assumption
The idea of a natural rate of interest has been around ever since the Swedish economist Knut Wicksell wrote about it in 1898. Early on, it was recognized that it's not something that can be directly observed or measured. As the economist John H. Williams wrote in 1931:
"The natural rate is an abstraction; like faith, it is seen by its works. One can only say that if the bank policy succeeds in stabilizing prices, the bank rate must have been brought in line with the natural rate, but if it does not, it must not have been."1
The topic gained renewed relevance in 1993, following John Taylor's famous description of a monetary policy rule that incorporated an assumption of a natural rate of 2 percent.2 For policymakers, the natural questions—pardon the pun—were: Is 2 percent the right number? Does it change over time? And how would we know? Those were the very questions than then-Federal Reserve Governor Larry Meyer posed to Board staff back in 2000. And that's what brought Thomas and me together.
A Meeting of Minds
In July of that year, I returned to the Board from a stint at the Council of Economic Advisors, shortly after Thomas joined the Board staff from the Kansas City Fed. We hit it off immediately. It just so happened that both of us had been thinking about the natural rate of interest. And since Governor Meyer had raised the subject, we moved quickly to develop an approach to answer his questions.
Although we didn't know it then, we were following exactly the problem the other John Williams laid out in 1931.3 Simply put, Thomas had a hammer. And we found a new nail. The hammer was the Kalman filter, which is about inferring the behavior of an object from its effects on other objects. And the nail was r-star.
A Fast Start
On December 14, 2000, after a few short months of working together, we wrote our ideas and results in a memo to the Board of Governors.4 The memo started with the bold declaration:
"This memo is a first report on a broader project to study alternative definitions and estimates of the equilibrium real rate (R*) and to evaluate their usefulness in the conduct of monetary policy."
And the Laubach-Williams (LW) model was born. Starting in May 2001, r-star estimates made their way into the staff Bluebook prepared for the FOMC.5
Looking back, I am struck by how quickly these ideas came together. I must also acknowledge the unwavering support we received from senior leadership to bring this new research to policymakers.
Within a year of writing the memo, we put out the academic version of this work.6,7 The original paper included a section on time-varying r-star's implications for monetary policy. But the editor cut it, leaving it "for future research."
What's Past is Prologue
Fast forward a decade, and an entirely new question about r-star arose: Why had estimates of r-star fallen so low? It's a topic Thomas and I explored in our "Redux" paper.8 And in 2017, Kathryn, Thomas, and I expanded the set of economies for which we estimated r-star.9
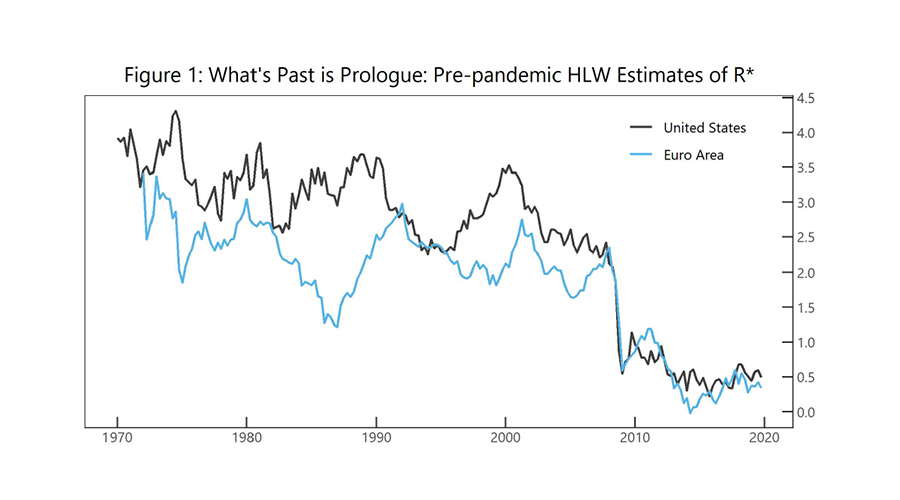
Indeed, before the pandemic, historically low estimates of r-star characterized advanced economies across the globe. This is illustrated by the Holston-Laubach-Williams (HLW) estimates of r-star for the United States and the Euro Area using data through 2019, shown in Figure 1. Both were around ½ percent before the onset of the pandemic, far lower than estimates from preceding decades.
Back to the Future
One of the features of the LW and HLW models is that both are designed to be flexible and to "let the data speak" in measuring changes in the natural rate of interest. Even this flexibility, however, has its limits. And the economic turmoil brought on by the COVID-19 pandemic went far beyond what the models were originally designed for.
In particular, the pandemic violated two key assumptions about the nature of macroeconomic disturbances underlying the models.10 First, the Kalman filter statistical method that serves as the models' workhorse assumes random disturbances to the economy follow a normal, or bell-shaped, distribution. Relative to historical experience, COVID-19 represented an extremely rare tail event in terms of its effect on the economy. Second, the models assume that these disturbances are serially uncorrelated, which is at odds with the sequence of shutdowns and reopenings associated with COVID-19.
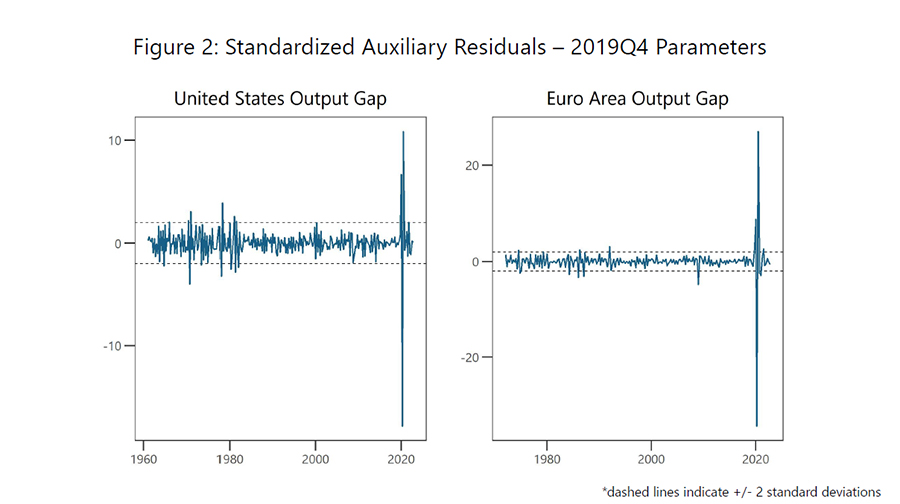
The highly unusual nature of the effects of COVID-19 is illustrated by the model auxiliary residuals for the output gap, shown for the United States and the Euro Area, in Figure 2. These residuals are related to the difference between the data and the model's prediction for the data. The dashed lines in the figure indicate two standard deviations. For the United States, these residuals are as large as 15 standard deviations, and for the Euro Area, they exceed 20 standard deviations in some periods. In a purely statistical sense, the probability of such an event occurring even once, much less twice, is infinitesimally small.
After the onset of the pandemic, we suspended publication of r-star estimates due to this extreme economic volatility and the elevated uncertainty about how the pandemic would evolve.
The Relaunch
I am pleased to report that starting today, we are relaunching regular publication of the LW and HLW estimates of r-star. The estimates, along with model documentation, are available on the New York Fed website and will be updated each quarter.11
To address the two violations of the original model assumptions caused by the pandemic, we made two modifications to the estimation of both models. I should note that this is described in detail in the paper, "Measuring the Natural Rate of Interest After COVID-19," that was posted this morning on the New York Fed's r-star web page.
First, we incorporated an additional persistent supply shock related to the effects of the pandemic that directly reduce the economy's potential. We measure this shock using the Oxford COVID-19 Government Response Stringency Index for each economy.12 This index aggregates measures of government containment and shutdown policies. Because the index is no longer being produced, we assume that in each case, it declines smoothly to zero over 2023-24.
Second, we use a statistical procedure that accounts for outliers in the model's estimation. Specifically, from the second quarter of 2020 to the fourth quarter of 2022, we estimate a time-varying process for the variance of the shocks hitting the economy. This procedure places a lower weight on periods when there are very large outliers.
Our results show that outliers are particularly large in 2020, as seen in Figure 2. By comparison, the estimated magnitude of outliers is relatively modest in 2021 and 2022. Starting in 2023, we assume that the distribution of shocks is no longer affected by the pandemic.
Letting the Data Speak
Estimation of the modified model reveals three key findings. First, the modified estimation procedure yields results that are overall quite similar to those from the original model during the pre-pandemic period. Second, the current estimates of r-star are similar to those estimated directly before the pandemic. Third, the estimates of the natural level of output at the end of 2022 are much lower than predicted before the pandemic.
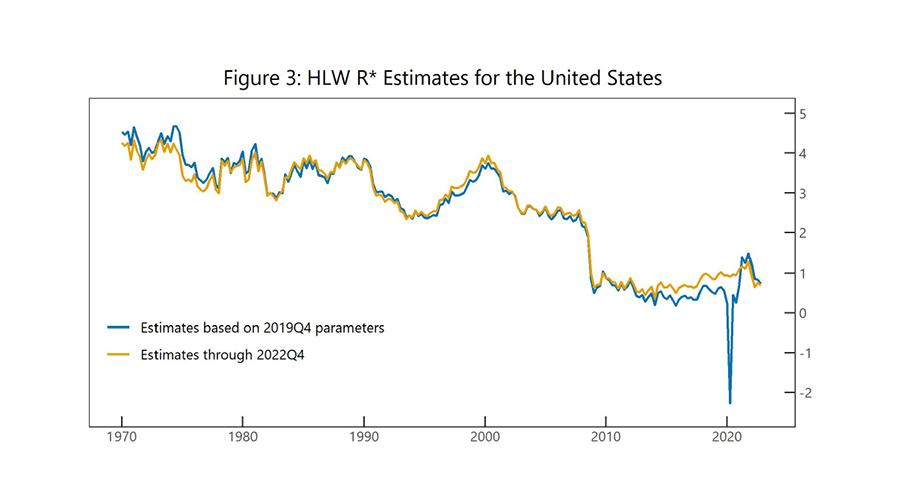
The current HLW estimates of r-star in the United States are shown in Figure 3. For comparison, the figure also shows estimates using a version of the model that is not adjusted to take into account COVID or outliers and holds the parameter values fixed at estimates using data through the end of 2019.
The two sets of estimates are very similar through 2019. They differ sharply during the acute period of the pandemic, however, when the estimates from the unmodified model exhibit large swings due to the presence of sizeable outliers. Interestingly, the two estimates are very close to each other at the end of the sample. That is, the modifications to the model do not interfere with "letting the data speak."
A Modest Imprint
Based on the new r-star estimates for Canada, the Euro Area, and the United States, we see no signs of a significant reversal of the decline in r-star estimates evident in prior decades.13 In fact, in all three economies, the r-star estimates in 2022 are within two-tenths of a percentage point of the corresponding estimate in 2019.
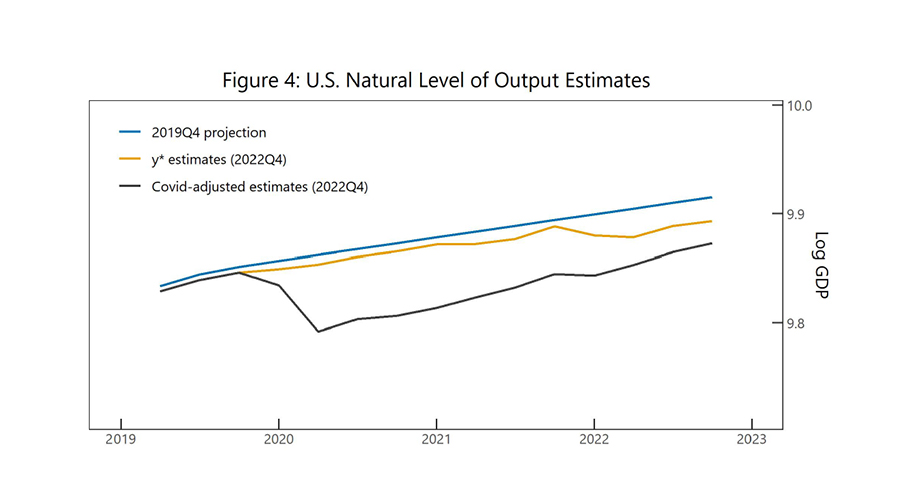
The largest differences between model estimates pre- and post-pandemic relate to the level of each economy's potential output. Figure 4 compares the model's measure of the natural level of output based on estimates using data through the fourth quarter of 2019 (the blue line) to current estimates. At the end of 2022, the COVID-adjusted level of potential output (the black line) is 4.2 percent below the pre-pandemic projection for the fourth quarter of 2022, with nearly half of that shortfall explained by the COVID shock measure and the remainder a permanent change in the natural level of output (the gold line).
In summary, according to the model estimates, the main longer-term consequence from the pandemic period is a reduction in potential output, but the imprint on r-star appears to be relatively modest. Importantly, there is no evidence that the era of very low natural rates of interest has ended.
The Future of R-star?
These estimates indicate that r-star today is about where it was before the pandemic. But where is it headed in the future? Of course, this is impossible to know with any certainty.
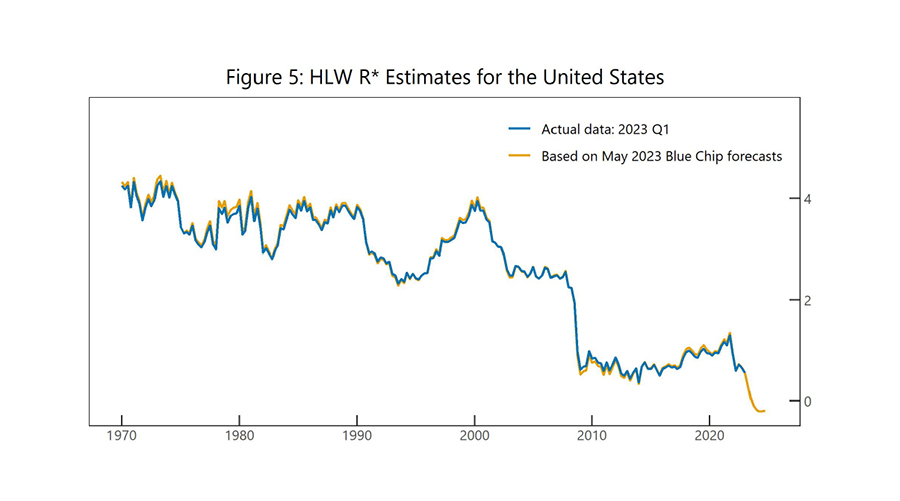
One way to gauge how forecasters perceive the future of r-star is to use forecast data to estimate it. Figure 5 shows the HLW-based estimates of r-star in the U.S. through the end of 2024. It uses published data in the first quarter of 2023. The May 2023 Blue Chip forecasts for inflation, GDP, and interest rates are used as proxies for data from the second quarter of 2023 through the fourth quarter of 2024.
The resulting estimate of r-star is about ½ percent in the first quarter of 2023, and subsequently falls to slightly below zero. Evidently, the value of r-star implied by private forecasts is, if anything, even lower than today's estimate. Time will tell whether this turns out to be the case.
No One Right Answer
Let me conclude by sharing something I learned from Thomas and hold dear. It's actually hidden in the last line of the abstract from our first published paper. It says: "Estimates of the natural rate of interest, however, are very imprecise and subject to real-time measurement error."14
To some, that may sound like a negative statement. But it's also what makes empirical research so exciting and challenging. There is no one right answer and no single way to view the world. Empirical research is a process of continuous learning and adaptation—fueled by perseverance. People come up with different approaches, and we learn from all of them.
So, while we started with the problem of how to estimate r-star, it didn't end with that first Board memo. Rather, it opened the door to new questions, which led to further challenges and even more research. This is the legacy of Thomas Laubach, and it's what brings us all together today.