The Credit Insecurity Index is a new tool that helps to provide a more comprehensive view of credit access and community credit health. By moving beyond metrics that traditionally focus on residents without a credit file or score, this Index incorporates an additional assessment of residents who are "credit constrained," that is, unlikely to obtain credit at choice to manage emergencies, take advantage of opportunities, or invest in one's future.
The report, Unequal Access to Credit: The Hidden Impact of Credit Constraints, explains how the Index provides a more complete picture of communities' financial security by scoring credit insecurity for states and counties over time. The report provides a detailed look at the Index's framework and methodology and includes detailed assessments of the nation using five credit insecurity tiers—ranging from "credit-assured" through "credit-insecure." By examining the Index over time, the report delivers insights on trends and mobility, how counties' credit insecurity tiers changed—upgraded or downgraded—from the financial crisis through the Great Recession and subsequent recovery (2007-2018). Collectively, the report provides evidence of the pace and level of progress in credit insecurity and provides information and observations that can inform community development policy and practice.
Given the breadth of the project, the evidence is presented in five sections, and each is a separate lens on how credit constraints depress access to credit and contribute to financial insecurity.
Credit Insecurity Index Framework
TAKEAWAY
All too often, residents with low access to credit at choice are overlooked in measures of access to credit. By omitting the impact of these residents on a community’s well-being, over half of the credit insecurity problem that communities actually contend with may be missed, and policy and practice may fall short relative to the severity of the need.
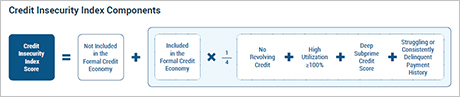
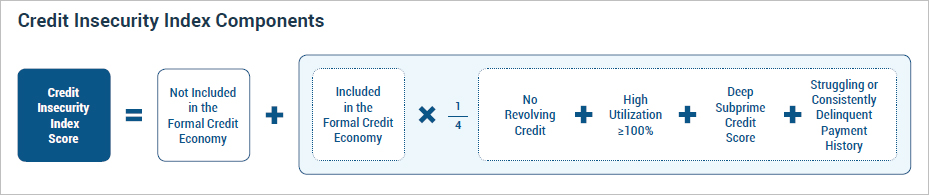
The Credit Insecurity Index is the sum of two Community Credit indicators: Not Included and Included, quality-adjusted to capture credit outcomes that make it unlikely for residents to obtain credit at choice.
Credit Insecurity Snapshot, 2018 Q4
TAKEAWAY
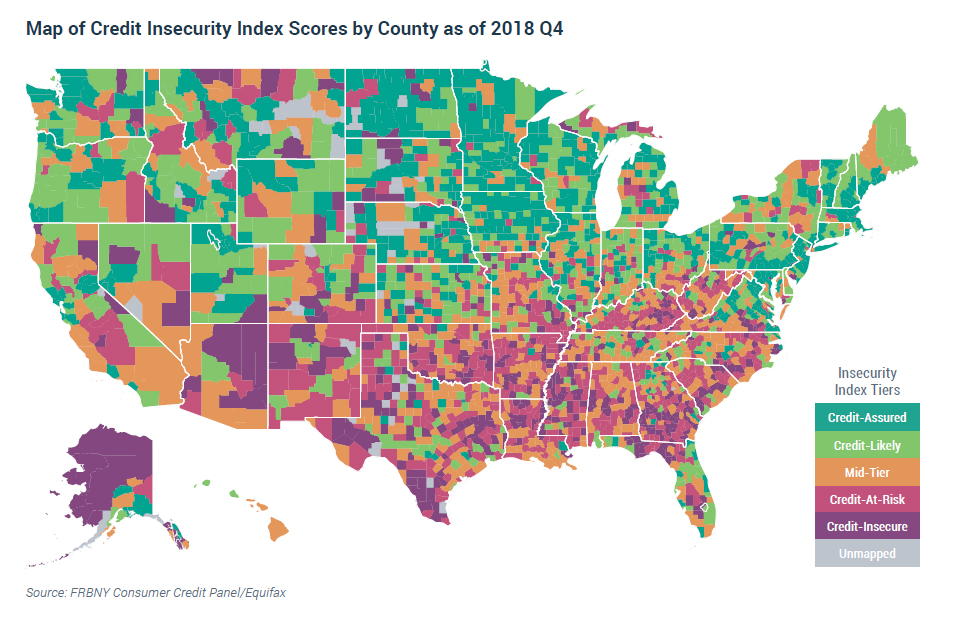
A snapshot of scores for the U.S., including all 50 states and most of the counties, shows that the impact of credit constraints on credit health varies considerably across communities. Altogether, 426 U.S. counties are identified as in the most severe credit insecurity tier, with another 643 counties in the second most severe tier. Geographically, there is some clustering of credit-insecure counties in the south and southwest regions of the country.
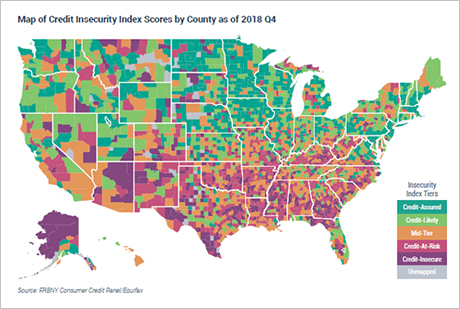
Credit Insecurity Index scores for most of the 3,142 U.S. counties as of the fourth quarter of 2018.
Credit Insecurity Trends
TAKEAWAY
Because the impact of credit constraints vary with macroeconomic conditions, the Index provides a tool with which to examine patterns from 2005 to 2018 when the U.S. economy suffered major economic disruptions and a recovery. Access to credit for opportunity was depressed in the nation and most communities during the financial crisis and recession through 2012. Unfortunately, the credit recovery, as of the fourth quarter of 2018, remains below 2007 levels of credit health for the U.S. as a whole and for many counties. Among the 50 states, New York had the best 2007 to 2018 improvement, with a stronger recovery than that of the U.S. Both New Hampshire and New Jersey achieved a full recovery to their 2007 level, while Wyoming had the weakest recovery in the nation and remains well above its 2007 score of credit insecurity.
U.S. counties show a similar overall pattern of post-2007 deterioration and recovery in credit insecurity.
Evidence of Progress in Credit Insecurity
TAKEAWAY
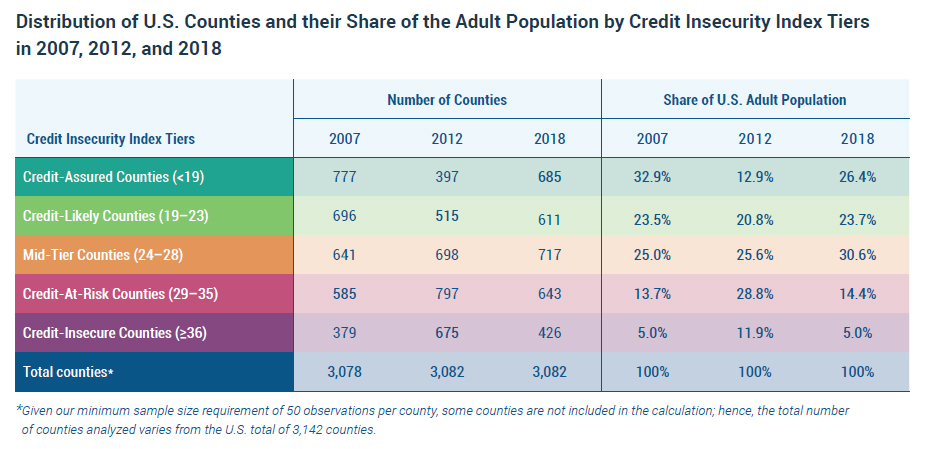
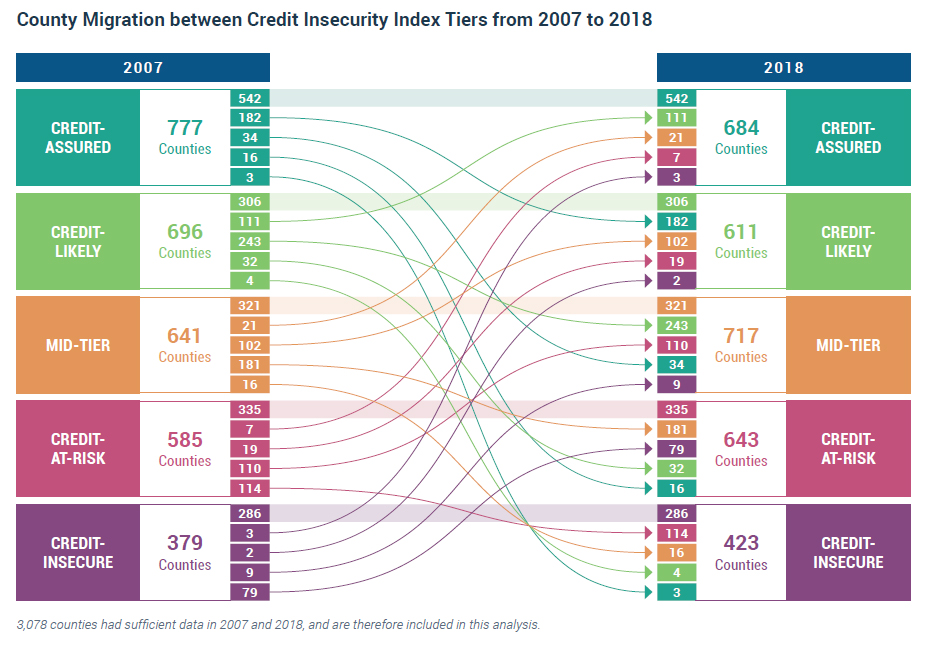
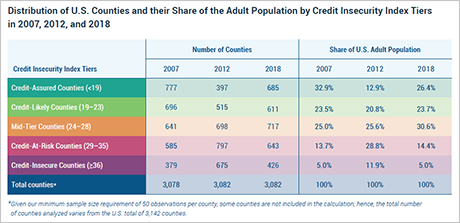
To understand progress, we examine the direction and magnitude of change at three economic turning points (2007, 2012, and 2018) by using two markers of credit mobility—migration among Index severity tiers and a change in Index score. The evidence suggests that progress is infrequent, and credit insecurity is persistent. For example, from 2007 to 2018, the overall distribution of counties shifted towards greater credit insecurity with 22.6% of counties experiencing tier downgrades. Among the majority of counties (1,790) that remained in their 2007 severity tiers, 286 counties remained in the most severe tier. Even during the recovery period of 2012–18 when the entire nation was improving, credit-insecure counties were more likely to have a weaker-than-U.S. progress trajectory than counties in other tiers.
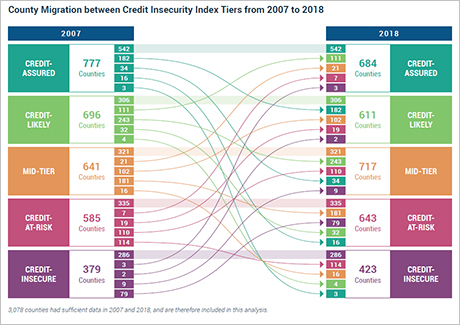
The broad horizontal bands represent counties whose severity tiers remained unchanged. The curved bands depict the flow of upgrades and downgrades between severity tiers.
Policy and Practice for Credit Insecurity
TAKEAWAY
The Index scores can be used by experts and community leaders with necessary local knowledge to assist communities and to scale policy actions to the relative severity of needs.
Observations for policymakers:
- The Credit Insecurity Index measures the impact of credit-constraining outcomes in a community; it is an efficient way to identify communities in distress and to size the magnitude of relative need.
- Index scores, by design, enable an apples-to-apples comparison among communities and situate local experience within the broader national context of place and history.
- The Index scores sort and rank communities by the relative severity of needs for policy opportunity and resource decisions.
- Over time, the scores can be used to monitor and evaluate the impact of new or additional investments in communities, by examining pre- and post-intervention community conditions.
- The report highlights counties where needs, without the Credit Insecurity Index, might be missed, overstated, or understated when assessing a community’s financial well-being.
- Index scores can track progress in credit insecurity over time and identify communities with persistent insecurity.