Thank you for the invitation to participate in today’s discussion about globalization and its effect on monetary policy in emerging market economies.1
U.S. financial markets, and the U.S. monetary policy stance, can significantly influence global financial conditions and capital flows.2 In no small part, this reflects the extensive use of the dollar in international trade and in financial transactions conducted outside the United States. The pricing and availability of financing for business activity around the world—even activity that does not directly relate to an American borrower, lender, producer, or consumer—often are influenced by conditions in U.S.-dollar money markets. And, understandably, the evolution and stability of dollar funding markets are a focus of attention for many economic policymakers around the world, especially here in the East Asia-Pacific region. As always, the views I will express today are mine alone and do not necessarily reflect those of the New York Fed or the Federal Reserve System.
My remarks today will focus on the implementation of monetary policy normalization in the United States and its contribution toward maintaining stability in U.S.-dollar money markets. I will start by reviewing progress on the Federal Open Market Committee (FOMC)’s program to normalize the stance of monetary policy. The FOMC has carefully laid out a clear and transparent normalization strategy and is implementing that strategy, and I believe that the confidence engendered by this clarity and transparency has been of great importance in maintaining market stability, both in the United States and globally. Experience so far has shown that the Federal Reserve’s monetary policy implementation framework has continued to provide appropriate control over the federal funds rate, even as the FOMC has moved to reduce the size of the balance sheet gradually and predictably. This stability has supported the orderly functioning of the broader set of dollar money market rates that are important to financial conditions in the United States and around the world.
Then, I will discuss the recent technical adjustment to the rate of interest paid on reserves (IOR). The Federal Reserve made the adjustment to provide greater comfort that the effective federal funds rate would remain within the target range set by the FOMC.3 I will discuss how this adjustment has had exactly the intended effect on money market conditions, and how it has reinforced my certainty that the Federal Reserve is well positioned to maintain the public’s high confidence in its ability to appropriately control overnight interest rates over the period of normalization.
I will then conclude with some comments on recent developments in broader money market rates, in particular U.S.-dollar LIBOR. U.S. term money market rates are of global significance, owing to the heavy use of the dollar outside the United States and the large stock of dollar-LIBOR-linked debt issued abroad.4 The spread of LIBOR to overnight indexed swaps has fluctuated in recent years, along with similar term unsecured dollar borrowing rates, driven in part by the same factors influencing overnight rates but also by specific past regulatory and legislative changes that have impacted flows in term markets. Evidence, such as from the FX swaps market, suggests that dollar borrowing markets continue to function well.
Policy Normalization Continues As Expected
I’d like to start by taking stock of where we are with the normalization of monetary policy in the United States. The Federal Reserve entered this tightening cycle with its overnight policy rate at the zero lower bound and with a large portfolio of long-duration securities. Normalization, therefore, has two parts: increasing the overnight rate, and reducing securities holdings to a smaller size. The FOMC began raising the overnight rate from zero in late 2015, and it began reducing the size of the portfolio late last year.
First: overnight rates. Due to the large supply of reserves that has accompanied the Federal Reserve’s expanded balance sheet, we are employing a new and innovative framework to control money market rates.5 Before the financial crisis, the Federal Reserve followed a well-worn playbook for monetary policy implementation that was based on keeping reserve balances scarce. Nowadays, however, reserves are no longer scarce. Our current framework relies, instead, on providing the market with two overnight investment opportunities to help steer money market rates: interest on reserves (IOR), which is the Federal Reserve’s main tool to control interest rates, and the overnight reverse repurchase agreement (ON RRP) facility, a secondary tool.
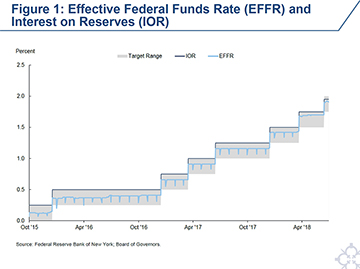
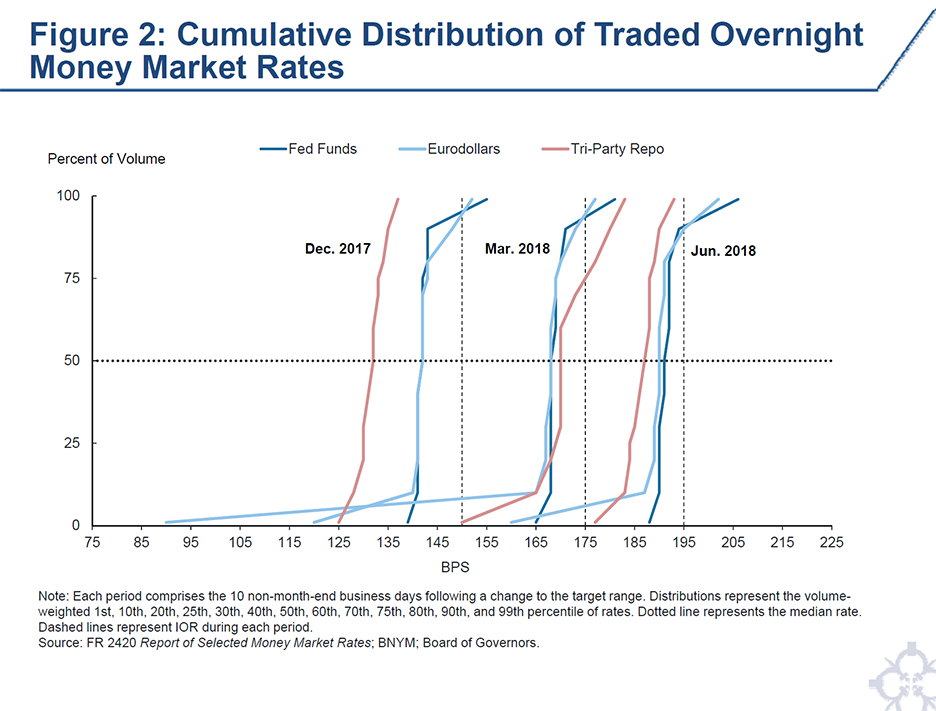
The current framework is simple and efficient to operate. In contrast, in the pre-crisis regime, hitting the target federal funds rate each day was a technically challenging exercise.6 We also have now had more than two and a half years to observe the performance of this framework, and it has proven to be extremely effective at controlling federal funds rates. As shown in Figure 1, it has maintained the effective federal funds rate within the FOMC’s target range on all but one day over the entire period.7 Looking at the distribution of traded rates within both the federal funds and overnight bank funding markets, as shown in Figure 2, it is also clear that the framework has broadly fostered trading at rates within the target range. Indeed, the difference between the 25th and 75th percentiles of the rate distribution has consistently remained very tight over the course of normalization.8
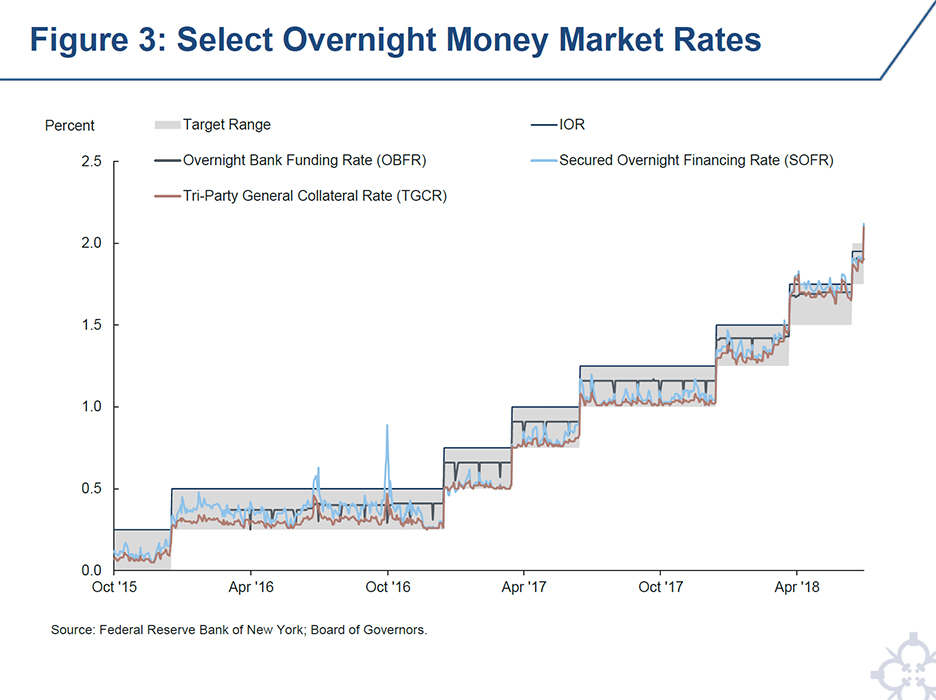
Of course, monetary control does not stop at the federal funds market: our framework must ensure that the stance of monetary policy is passed through into other money markets. It has also been very successful in this sense. Figure 3 shows a broad selection of secured and unsecured overnight money market rates; it is clear that increases in the target range for the federal funds rate have passed through fully and immediately to the other rates, as expected and intended. Moreover, I have been very encouraged by the relative stability and high degree of co-movement among short-maturity money market rates.
And second: the balance sheet.9 The Federal Reserve’s balance sheet grew markedly earlier this decade as a result of large-scale asset purchase programs, which were undertaken to support the economic recovery by easing financial conditions to a greater extent than could be achieved solely through reducing the federal funds rate. For many years, the FOMC has indicated its intention that the Federal Reserve will, in the longer run, hold no more securities than necessary to implement monetary policy efficiently and effectively, and that it will hold primarily Treasury securities.10 Starting late last year, the Federal Reserve began a program to reduce its securities holdings by reinvesting principal maturities only to the extent that they exceed gradually increasing caps.11 This gradual and predictable approach is intended to reduce the balance sheet’s size at an appropriate pace while supporting good market functioning and mitigating the risk of sharp or outsized asset price reactions.
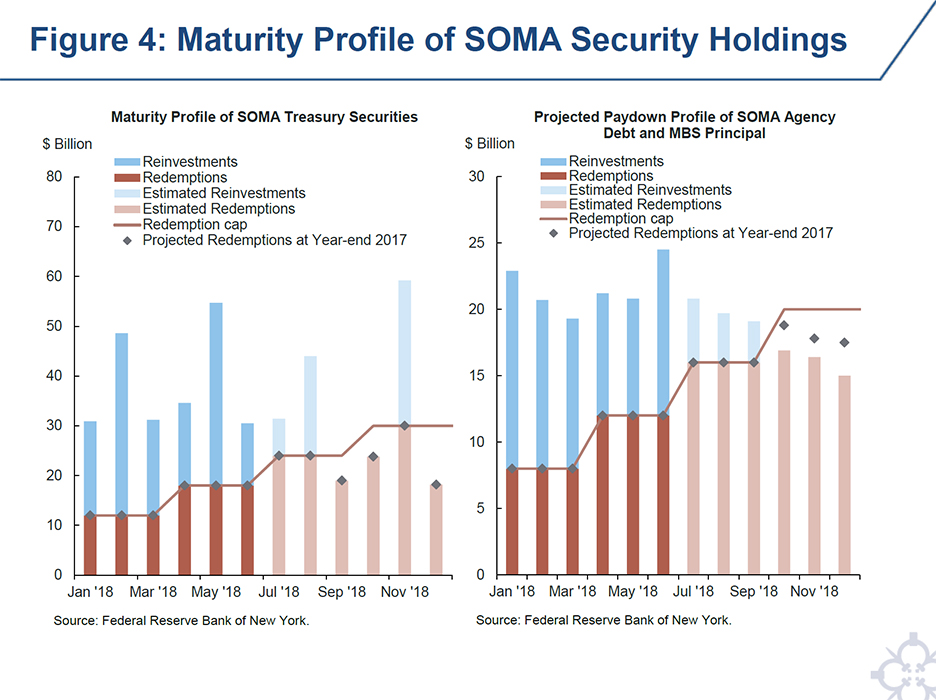
The charts in Figure 4 show the evolution of the Federal Reserve’s securities portfolio. Up to the present, the full length of the bars show the actual amounts of Treasury securities and agency debt and MBS principal that matured or paid down early. Only the amounts above the cap were reinvested. As can be seen, we have delivered a gradual and predictable reduction in the size of the balance sheet. This has been accomplished without any evidence of market disruption or volatile price movements; it has been, as former Chair Janet Yellen once said, like “watching paint dry.”12
The charts in Figure 4 also show the projected progression of the portfolio for the rest of the year. Runoff from the balance sheet increases over the projection horizon, as the caps attain their terminal value later this year. As had been expected at the start of the program, principal repayments from our agency MBS portfolio are projected to eventually start coming in below the level of the caps. Based on current projections, principal payments on the Federal Reserve’s holdings of agency MBS would likely be lower than the monthly cap on redemptions that will be in effect beginning in the fall of this year. Consistent with the Policy Normalization Principles and Plans, when this occurs in a given month, no reinvestment occurs, and the portfolio size declines by the amount of principal repayment. It is important to remember that mortgage principal repayments are uncertain; are sensitive to various factors, particularly long-term interest rates; and could conceivably rise above the level of the cap in the future, particularly if interest rates were to decline. If this were to occur, those amounts above the cap would be reinvested. The cap-based program to normalize the balance sheet was designed at the start to operate exactly in this way: it is the mechanism by which the decline in the balance sheet is kept to a gradual and predictable pace. I expect that the Desk will conduct operational readiness exercises during periods of no reinvestment to ensure it remains prepared to reinvest if needed.13
Flexibility When Needed: The Technical Adjustment
All of this news is encouraging, and it confirms the efficacy of the FOMC’s plan to normalize the stance of policy. I’d like to turn back to overnight rates for a moment, to speak about the recent technical adjustment to the IOR rate and try to answer a few questions that have emerged.
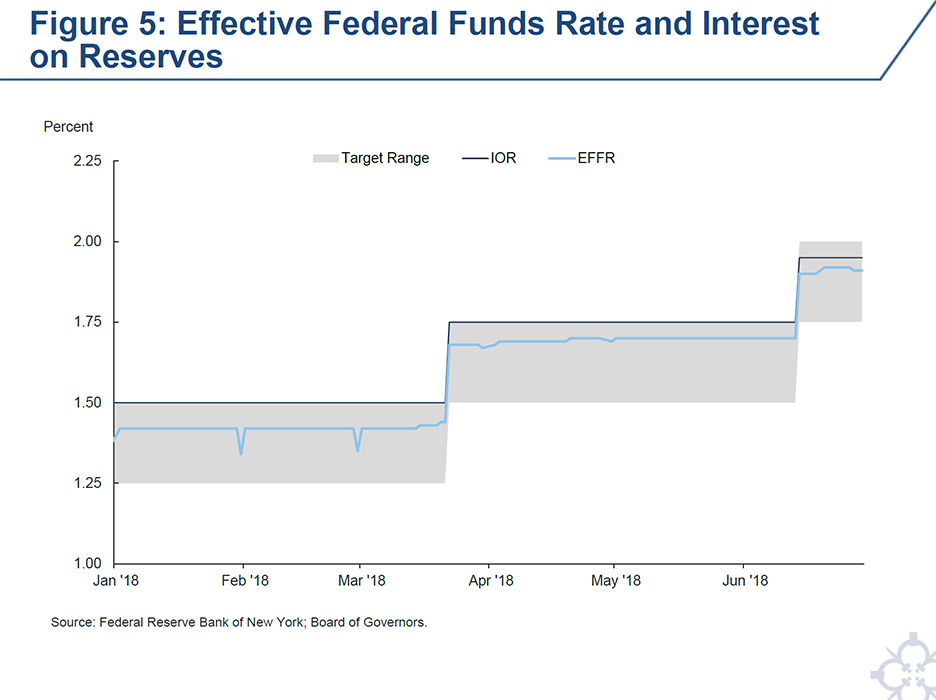
Although they remained within the FOMC’s target range, rates paid on the bulk of federal funds trading had ticked up, as can be seen in Figure 5. By April 2018, the effective federal funds rate was five basis points below the top of the range. This rise raised a question as to whether the effective federal funds rate might print above the top of the FOMC’s target range, absent a change in our operational settings.
The target range is an important feature of the FOMC’s public communications, and maintaining federal funds rates within it is therefore taken quite seriously. Public confidence in our ability to maintain rates within the target range is important for ensuring that expectations for the FOMC’s future policy stance are properly incorporated into the term structure of interest rates, and thereby appropriately affect financial conditions and the broader economy.
To address the rise, the Federal Reserve made a technical adjustment to the IOR rate at the June FOMC meeting, raising it by 20 basis points while increasing the target range by 25 basis points.14 The technical adjustment worked exactly as we expected. As you can see back in Figure 2, all rates paid on federal funds borrowings, as well as in other money markets, rose by about 20 basis points. This made it less likely that the effective federal funds rate would be above the top of the target range.
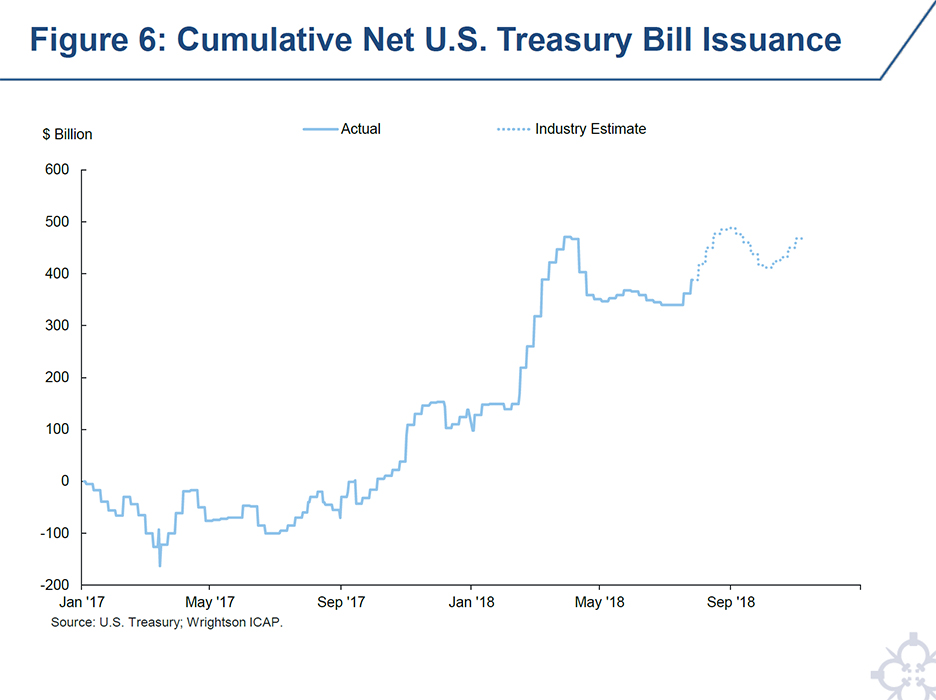
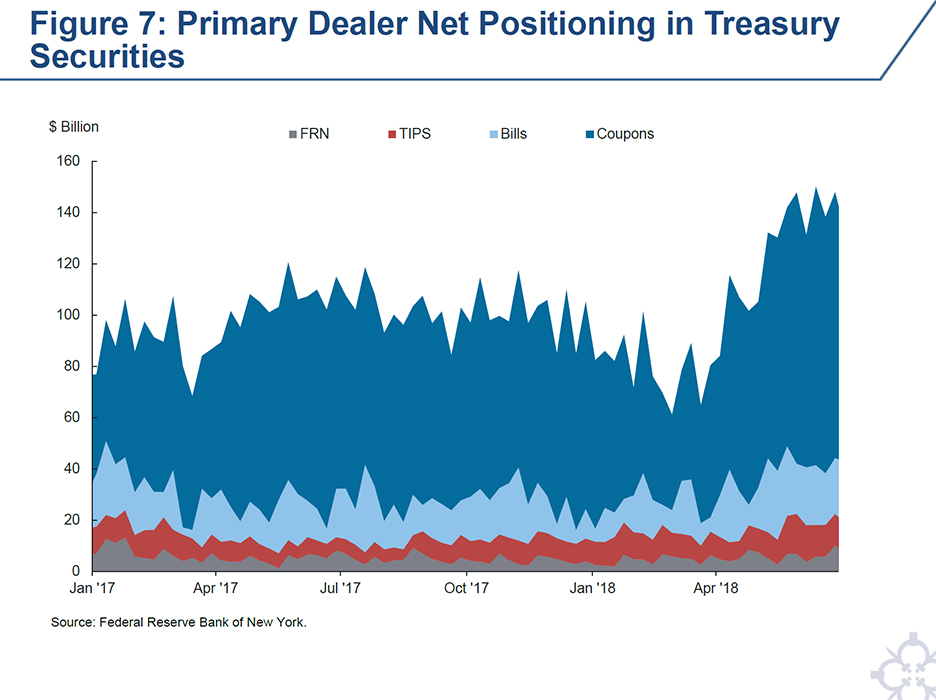
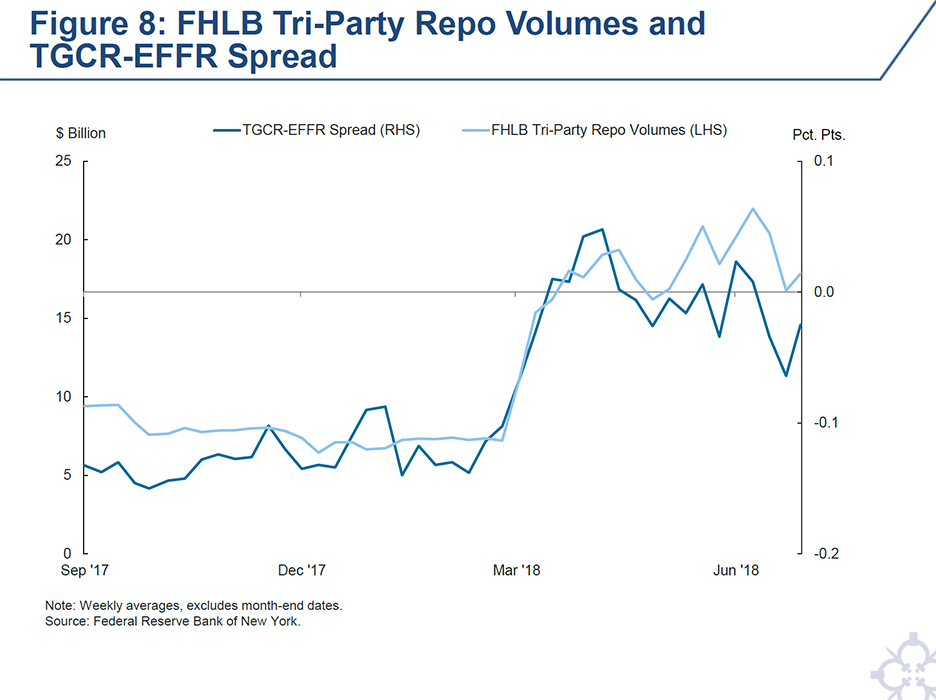
Let’s spend a few minutes exploring what drivers might have been most significant in bringing about the rise in money market rates relative to IOR.15 Leading into the technical adjustment, a shift in flows in the Treasury market had the effect of pushing both Treasury bill yields and repo rates higher in February and March. Figure 6 shows cumulative net Treasury bill issuance since the beginning of last year, as well as projections through the third quarter of this year as reported by a private-sector forecaster. The substantial run-up in net bill issuance over the past few quarters, along with other factors, contributed to notable growth in securities dealers’ inventory of Treasury securities, shown in Figure 7—inventories that likely required financing in the repo market. Before these developments, Treasury bill yields and repo rates had been well below federal funds rates. The increases created an attractive alternative investment opportunity for federal funds lenders, including the Federal Home Loan Banks (FHLBs), which make up about 95 percent of current overnight lending in the federal funds market. Figure 8 shows that as repo rates rose relative to federal funds rates, volumes of FHLB lending in the repo market increased as some of the FHLB activity shifted into this market. As federal funds borrowers competed for this reduced pool of funds, rates rose.
You may notice on Figure 1 that the federal funds rate had been rising within the range well before these recent shifts in Treasury market flows. This gradual and slow rise coincided with the ongoing decline in reserve balances that is a part of balance sheet normalization, which has raised the question of whether the decline in reserves might be putting upward pressure on overnight rates.
In the academic literature on monetary policy implementation, models for the behavior of the overnight interbank rate generally boil down to its relationship with the stock of bank reserves.16 These models generally find that as reserve balances decline, the overnight interest rate goes up, but not uniformly. At high levels of reserves, the responsiveness of rates to changes in reserve levels is fairly low, and the demand curve is said to be “flat.” As excess reserve levels decline, the responsiveness of rates increases. At low levels of excess reserves, the overnight rate responds sharply to small adjustments in the level of reserves: the demand curve is “steep.”
It seems highly likely that we are on the “flat” part of the curve, the part where rates move little in response to shifts in reserves. But this does not quite answer the question on whether the decline in reserves might be putting perhaps some upward pressure on rates. Even in the “flat” part, the slope of the demand curve, while small, might be nonzero. This could be true if, for example, the balance sheet costs of the marginal borrower in overnight money markets were upward sloping with respect to that bank’s balance sheet size. I see this as a reasonable possibility, and therefore I think it might be possible that the decline in reserve balances has pushed up overnight rates a bit over time.17
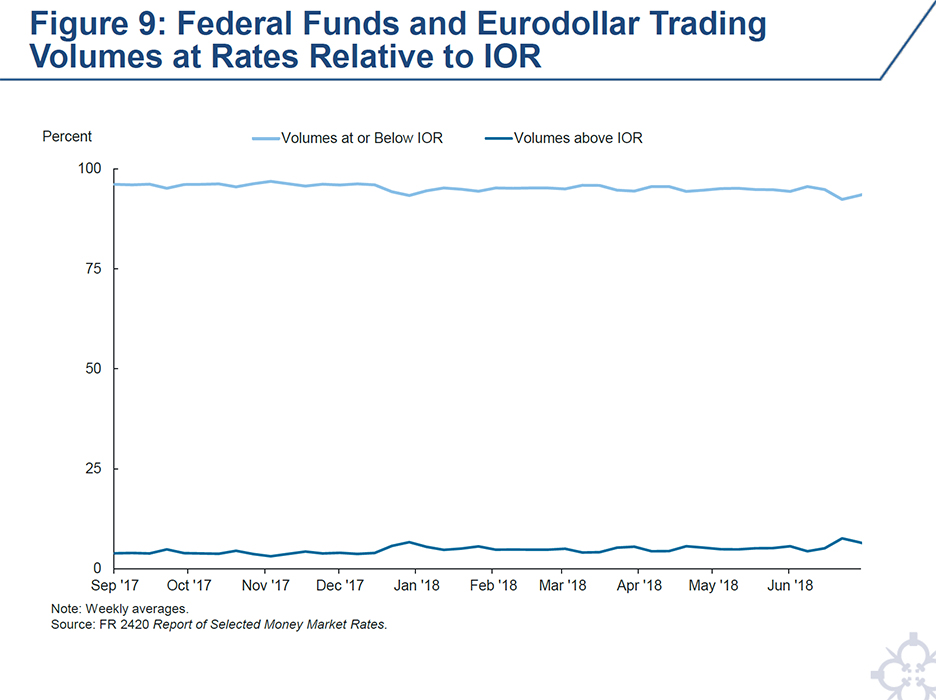
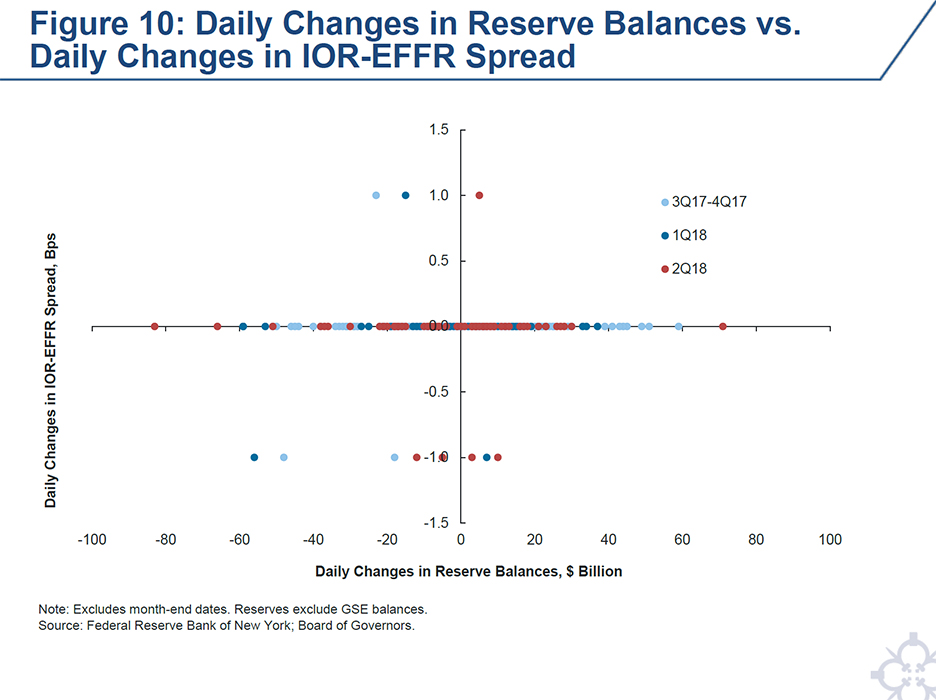
At this point, I see no evidence that we are at, or close to, the “steep” portion of the demand curve.18 Let’s run through some places where evidence of such a possibility might be found. To begin with, if we were closing in on the “steep” part, I might have expected to see more above-IOR lending in the unsecured overnight markets, as at least some banks each day found themselves short of reserves and had to borrow them from another bank. In fact, the amount of such above-IOR lending remains low as a share of the overnight bank funding market, as shown in Figure 9.19 I might also have expected to see shifts in bank payments behavior—for example, more daylight overdrafts or more effort by banks to “optimize” their payment flows—but I have not seen this either. But, most fundamentally, I might have observed a day-to-day relationship between shifts in the stock of reserves and overnight interest rates. Figure 10 shows a scatterplot of daily changes in reserve balances against daily changes in the spread between the IOR rate and the effective federal funds rate; there is no visible relationship.
Let me offer some caveats to these observations. Money markets have been and are now changing quickly in response to regulatory, technology and business model incentives.20 At the same time, reserves in the system have been abundant because of the asset purchase programs—perhaps smoothing through the effects of some of these changes. Staff at the Federal Reserve has been using new data sets, analytics, and extensive market intelligence to deepen our understanding of the impact of these changes on money market dynamics. What follows is an illustration of this enhanced understanding.
In the pre-crisis monetary policy framework, banks’ regulatory obligation to hold reserves was primarily driven by the required reserves framework, set forth in the Federal Reserve Act and Regulation D.21 This framework involved banks meeting their requirement over a 14-day reserves maintenance period, as well as various other incentives that promoted short-term, but not extremely high-frequency, bank balance sheet management activity to maintain reserves at required levels—and the Federal Reserve had built analytics to provide good visibility into it. Today, while the Regulation D framework is still around, it is no longer likely to be the binding constraint on reserve levels for most large banks.22 The new factors driving reserves demand appear to vary by financial institution, and seem to depend on a complex interplay of numerous new features of the financial system. On the regulatory side, these include the Liquidity Coverage Ratio (LCR), banks’ internal stress tests of their liquidity adequacy, supervisory expectations related to banks’ ability to monetize their liquidity portfolios during periods of financial stress, and the incorporation of liquidity into resolution planning. Other important factors include increased bank aversion to incurring intraday overdrafts, higher bank investor and creditor expectations for liquidity, and a lower opportunity cost of holding reserves relative to before the crisis.23
Not only will this system likely mean that banks’ binding constraint on reserve levels will be different from before the crisis, but also that bank behavior when reserves decline will likely be different. For example, in comparison to the 14-day maintenance period I mentioned earlier under Regulation D, many of these new constraints are measured quarterly, while some are measured daily for certain purposes. This means that signs of reserve scarcity may emerge differently and on a different timescale than they would have in the old system. Moreover, banks have various ways to meet their obligations under this system: their choices are not limited to simply holding more reserves. As a result, reserve scarcity may be accompanied by shifts in market pricing and flows that we might not have seen in the old framework. Finally, the old system provided a degree of stability over time through its ability to reallocate scarce reserves among banks in response to shocks through interbank lending in the federal funds market. This interbank activity largely dried up following the crisis and has not meaningfully returned—in part due to regulatory incentives, but also because banks report that they are now less interested in taking on financial exposure to other banks.24 As a result, it is possible that a regime of less abundant reserves may now be accompanied by an element of increasing volatility or periodic turbulence in money markets.
One new way in which scarcity might manifest itself going forward is through effects related to the LCR. Very generally, the LCR is designed to ensure that banks hold a sufficient reserve of high-quality liquid assets (HQLA) to allow them to survive a short-term period of significant liquidity stress. Now, balance sheet normalization involves reducing the private sector’s holdings of one type of LCR HQLA, reserves, and increasing others—Treasuries and agency MBS—by an equal aggregate amount, so normalization does not make HQLA writ large more scarce.25 However, within the universe of HQLA, reserves are especially liquid: they can be used to make payments at any time without the need to sell or finance an asset in financial markets, which in a stressed environment might be difficult or costly. As a result, as the aggregate stock of reserves declines over balance sheet normalization, competition among banks may intensify for ways to bolster their measured liquidity position.26
Such increasing competition could affect money markets by increasing the differential between different types of money market borrowing based on its treatment under the LCR. The LCR determines a bank’s expected cash outflows by multiplying the outstanding balances of various categories of liabilities by various supervisory “runoff rates,” which are meant to reflect the relative “stickiness” of that type of liability.27 Borrowing cash in overnight wholesale markets from another financial institution, such as a bank or a money market mutual fund, does not help a bank’s liquidity position as measured by the LCR, because the rule assumes this funding completely runs off during periods of financial stress.28 However, borrowings from certain other kinds of lenders, such as public-sector entities, foreign central banks, and nonfinancial corporations, receive lower runoff rates, as the LCR rule considers these types of lenders to be “stickier.” In particular, borrowing from the FHLBs, the predominant lenders in the federal funds market, is one example of LCR-favored wholesale borrowing. So, if banks were becoming more interested in improving their LCRs, they might seek out, and pay up for, loans from the FHLBs and other LCR-favored lenders.
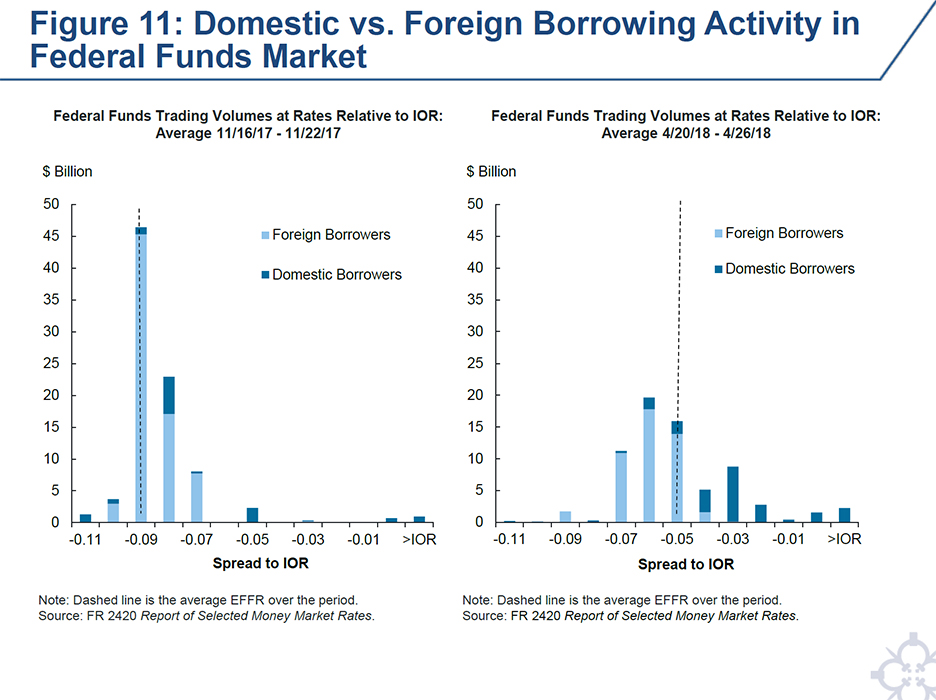
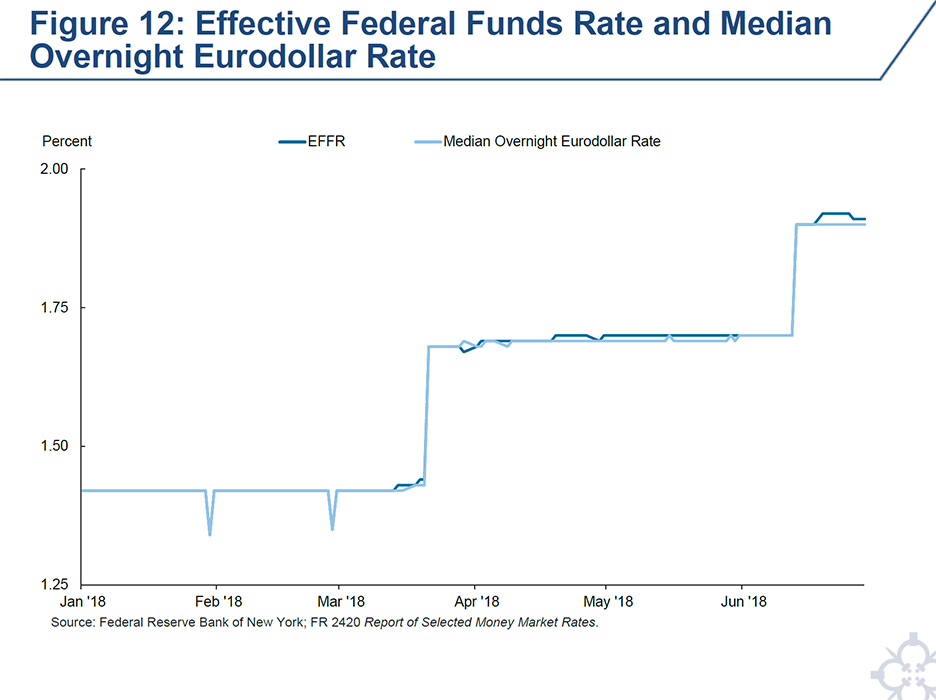
Recent data indicates that LCR-related demand has pushed up the effective federal funds rate at times, notably in June. Looking at the distribution of federal funds rates this year, Figure 11 shows that the rates paid by domestic banks has increased relative to the rates paid by foreign banks. Last year, these two types of firms paid fairly similar rates. My read is that the foreign banks are generally borrowing in the federal funds market primarily to earn a spread between the IOR rate and the rate they pay to borrow funds, while some of the domestic banks, while also sensitive to the rate they pay, are borrowing in these markets to improve their LCRs. It seems like this more motivated borrowing activity helped bid up rates a bit. Figure 12 shows that, since June, we have seen small and brief divergences between rates in the federal funds and Eurodollar markets, which reflects transitory pricing of a premium on LCR-friendly borrowings around a period of heavy payment flows due to a federal tax payment due date.29 This small effect is a minor illustration of the transitory money market “turbulence” I mentioned earlier. However, since these effects have been small and short-lived, I don’t see them as signaling that we are at or close to reserve scarcity.
Taking a step back, it is hard to be definitive on the recent drivers of moves in short-term money markets. The markets have economically complex structures, and in particular, a high degree of concentration within some money market segments. Further, the prevalence of standing business relationships has seemed to mean that in practice transitory shocks can have more permanent effects on pricing. Indeed, despite a recent decline in repo rates, the effective federal funds rate has remained fairly stable at nine basis points below the top of the range.30 Moreover, there have been various other recent shocks that may have influenced money market flows and structure, such as those from recently enacted tax reform measures.
There are various opinions in the market on how things go from here. Some believe that we might see federal funds rates remain at a similar spread to IOR or rise somewhat closer to it—for example, due to a forecasted seasonal increase in net Treasury bill issuance heading into the end of the year. Others see the recent tightening of federal funds to IOR as overly large relative to historical experience, and think this will retrace somewhat.
Based on what I know now, it seems like a strong possibility that rates paid on borrowing in the federal funds market will remain within the target range for now with the current settings of the Federal Reserve’s monetary policy toolkit. But, more importantly, I am confident that the Federal Reserve has the capacity to ensure that it will continue to achieve its goals, such as through another technical adjustment, should such action seem appropriate. What matters to the public and for broad financial conditions is the effective stance of monetary policy, which at the Federal Reserve is communicated by the target federal funds range and its transmission to other money markets.
Fluctuations in Term Money Markets
Let’s shift gears and talk about term dollar money markets. As I just discussed, the Federal Reserve’s policy target is the federal funds rate, which is an overnight rate of interest in the wholesale market. While the goals for monetary policy are maximum employment and price stability, the economic decisions of households and firms generally don’t depend directly on the federal funds rate, since these parties do not participate in that market. Instead, their decisions depend on broader financial conditions, including the interest rates on home mortgages and corporate bonds, the performance of the stock market, and the foreign-exchange value of the dollar. As a result, for monetary policy to achieve its objectives, markets must function well enough to transmit the stance of policy, both from the markets in which the Federal Reserve directly transacts to its policy target, and then onward from that target to other money markets, and eventually to asset prices (bond yields, mortgage rates, equities, and exchange rates) that more directly affect real activity in the U.S. economy.
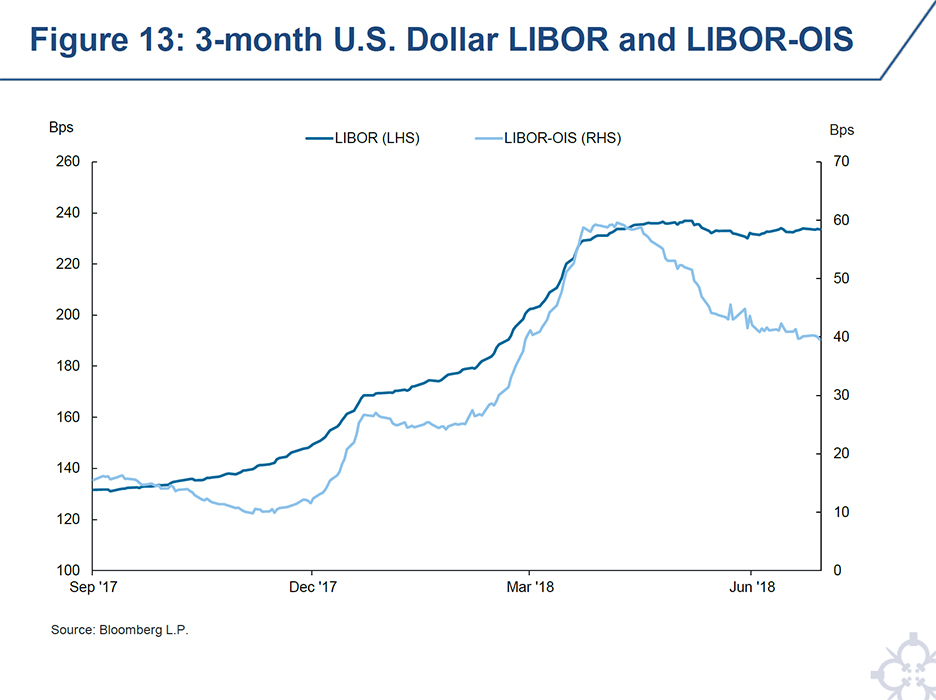
Because the various money markets are important to achieving the Federal Reserve’s macroeconomic mandate, we monitor developments in them closely. In recent months, we have observed notable fluctuations in some term money market rates relative to the expected average level of the effective federal funds rate over the same horizon. This has been particularly true of the spread between three-month dollar LIBOR and equivalent-tenor expected future federal funds rates, as measured by overnight indexed swaps, or OIS, as shown in Figure 13, but is also the case with rates paid on borrowings such as commercial paper.
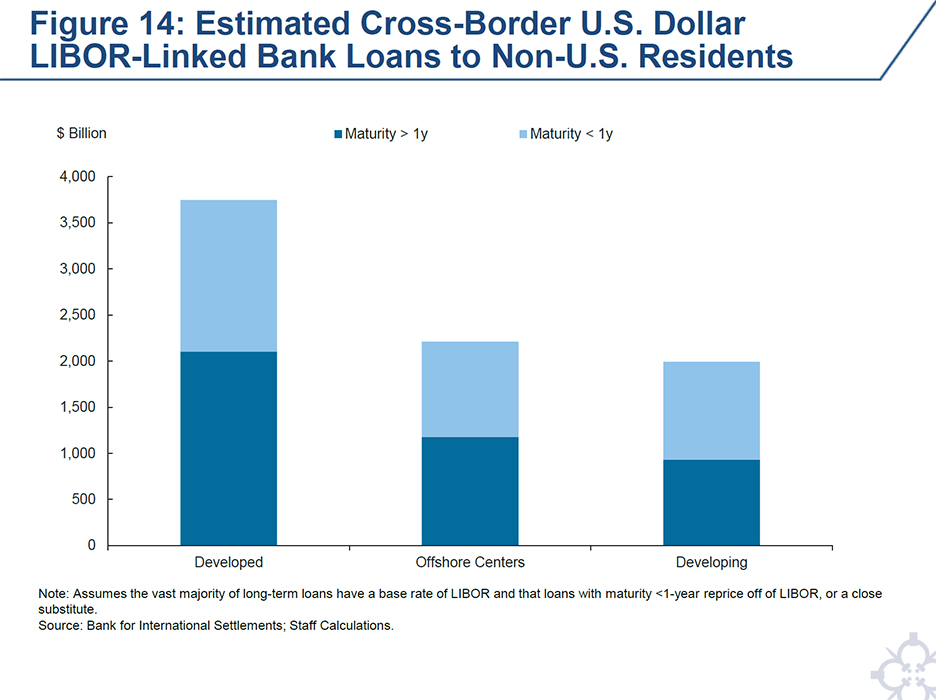
These longer-term money market rates are important to U.S. domestic activity to be sure, but they are also of significance abroad, especially in countries with highly trade-oriented economies. In this regard, we have seen continued growth in recent years in the stock of loans linked to U.S.-dollar LIBOR made to non-U.S. firms. As shown in Figure 14, the Desk estimates that U.S.-dollar cross-border bank loans to non-U.S. residents that could be directly or indirectly impacted by U.S.-dollar LIBOR—the sum of the three columns in the panel—total about $8 trillion, a significant portion of which is in developing economies. This reflects both the deep, liquid, and global nature of U.S. financial markets, as well as the dollar’s role as a reserve currency and the primary currency used for international trade.
My assessment is that the increased supply of Treasury bills and shorter-term Treasury coupon securities has played an important role in putting upward pressure on these rates at times. I think there is also evidence that other policy drivers have played an important role. For example, the recently enacted Tax Cuts and Jobs Act (TCJA) provides for “deemed repatriation” of corporate profits that had not yet been subjected to taxation in the United States. It appears that some corporations that previously had significant untaxed earnings—and that previously held large stocks of cash on their balance sheets—have begun to alter their capital structures, either by distributing cash held on balance sheet as dividends or by investing it in other assets. Some of this activity may have resulted from the passage of the TCJA’s repatriation provisions; it may also be related more generally to the recent strength of the economic expansion and the high level of consumer and business confidence. It is hard to precisely quantify the extent to which these cash shifts have affected money markets, but it seems likely at this point that they have had an effect, at least for a time. Finally, it is important to be clear that there is no evidence that bank funding stress has contributed to this recent increase in LIBOR, in contrast to rises seen during the 2007-2009 global financial crisis and 2011-2013 European sovereign debt and banking crisis.
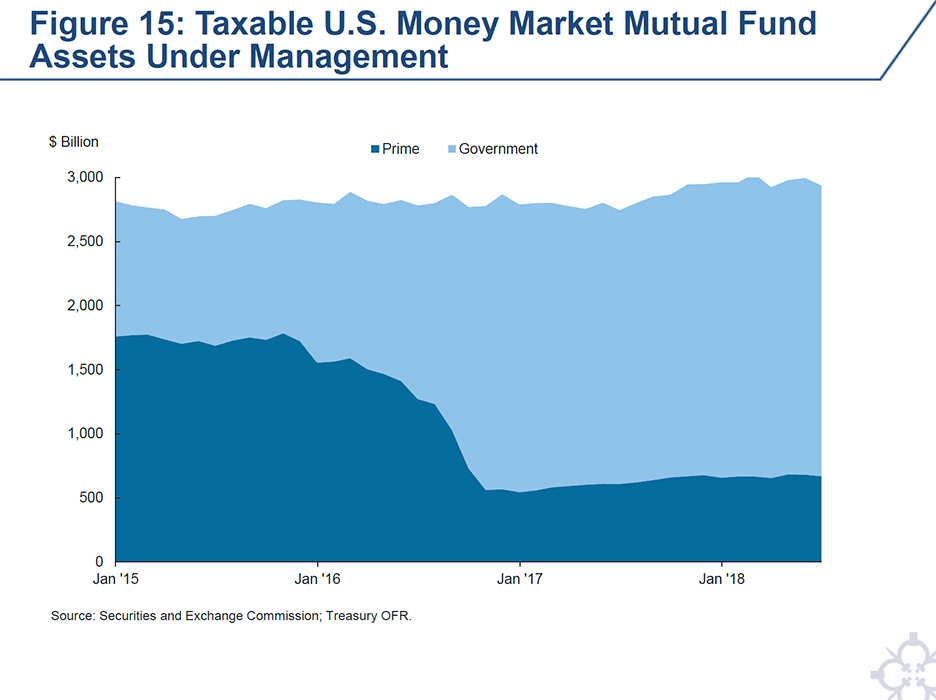
Another important consideration in the recent fluctuations in term rates is that there is an ongoing, longer-term adjustment in U.S. money markets related to the 2016 reform of money market mutual funds (money funds). The fragility of money funds—demonstrated in 2008 when a large money fund “broke the buck,” other money funds were hit by runs, and the Treasury stepped in to guarantee money fund liabilities—has been mitigated by this reform. It had the effect of sharply reducing the size of prime money funds, which have a broad capacity to invest across money markets, and increasing the size of government money funds, whose mandate is more restricted, as shown in Figure 15. In and of itself, this shift seems likely to have made money markets more segmented, and more prone to the “turbulence” in response to shocks I mentioned earlier.
Longer term, this regulatory shift has catalyzed a deep and complex impact on the structure of money markets, which is still unfolding nearly two years later. These effects have included an ongoing increase in the role of FHLB advances as means of intermediation between government money funds and financial firms, as well as ongoing efforts by a wide variety of borrowers and lenders to broaden their counterparty lists and consider new operating frameworks so as to best accomplish their business objectives in the new money market environment. For example, although the FHLBs for years focused their liquidity management on the federal funds market because it provides a high degree of intraday liquidity, they are now beginning to explore greater use of bilateral repo, as that market has similar characteristics and can at times provide them with a higher return. It is likely that these ongoing shifts in money market structure have contributed to fluctuations in rates and spreads, and that they will continue to do so.
I view fluctuations in term money market rates of the magnitudes seen recently as normal parts of market functioning during a period of structural change. Wholesale dollar funding, though more expensive, has remained readily available both in the United States and abroad. Importantly, there are no signs of worsened counterparty concerns among banks, and spreads in the FX swaps market in dollar and other advanced-economy currency pairs have tightened in recent months, demonstrating that foreign firms that wish to obtain dollars by providing foreign currency effectively as collateral can do so on reasonable terms.
That said, I do recognize that capital flows to emerging market economies have diminished in recent months. But, this shift appears to be largely driven by divergence in near-term growth momentum, which has supported the dollar and triggered some pullbacks in portfolio flows and reduced borrower demand, and not by general dislocations in the availability of short-term dollar funding.
We will continue to monitor developments in U.S. and global dollar funding markets closely, as we always do. In this regard, our ongoing dialogue with fellow central bankers, including through meetings such as this one, provides us with very valuable insight and perspective. As part of the New York Fed’s ongoing engagement in and commitment to the region, we are pleased to be partnering with Bank Indonesia on a joint Central Banking Forum, which will take place prior to the 2018 Annual Meetings of the International Monetary Fund and World Bank Group in Bali in October. This forum will highlight economic and monetary policy developments in the United States and emerging markets as well as geopolitical and technological trends and their implications for central bankers. We hope that you and members of your delegation will be able to join us for this event.
Concluding Remarks
To conclude this discussion: I remain highly confident that the FOMC’s framework for the normalization of the stance of monetary policy—both in the overnight market and in the balance sheet—will continue to proceed smoothly, without unnecessary surprise, disruption, or volatility in financial markets. The monetary policy implementation framework continues to provide the FOMC with excellent control over overnight money market rates, and has proven its ability, including recently through the technical adjustment, to flexibly respond to new developments. Although term money market rates have fluctuated recently in response to a variety of drivers, these markets continue to act as a deep and liquid source of wholesale funding to firms around the world while appropriately incorporating the FOMC’s monetary policy stance.
Before I go, allow me to offer a few last thoughts on economic and financial stability as monetary policy normalization proceeds. The real rate of interest in the United States has been rising, and it seems that, before long, investors will be able to earn a positive real rate of return by investing even in riskless, overnight dollar assets. Now, there is nothing especially magical about “crossing the boundary” between negative and positive real rates, and I do not expect anything out of the ordinary to happen when we do. But, it does seem a notable signpost on the road to a more normal monetary policy.
Since the crisis, the FOMC’s accommodative monetary policy stance has helped support an economic recovery and expansion both in the United States and around the world. But, it has not done this alone: it has had the support of a wide variety of policy actions—most notably, but not limited to, financial regulatory reform aimed at bolstering economic resiliency and reducing the economy’s propensity toward boom-and-bust cycles. Going forward, maintaining the U.S. economy on a sustainable trajectory, including through transparent monetary policy implementation and effective and efficient regulation, is our best means of contributing to prosperity both at home and in the broader global community.
Thank you for your attention. I look forward to the panel discussion.