Thank you for inviting me to speak and for that kind introduction. For years I have had the privilege to be a part of the audience at these events, and it’s an honor to be asked to address the group.
Since the financial crisis, the Federal Reserve has used short-term interest rates and its balance sheet to achieve its policy objectives. In my remarks this evening, I will make some observations on the current approach to influencing short-term interest rates and the execution of operations by the New York Fed’s Open Market Trading Desk, and consider how these operations might evolve as the Federal Reserve eventually normalizes its balance sheet. I will also look back at our past experience, which may offer perspective as we prepare for what lies ahead. The views presented are mine alone and do not necessarily reflect those of the New York Fed or the Federal Reserve System.1The Federal Reserve’s Monetary Policy Implementation Framework Is Working Well
The Federal Reserve has successfully raised the overnight federal funds rate three times since December 2015 in the gradual process of normalizing the stance of monetary policy. During this time, the effective federal funds rate has printed within the prevailing target range set by the Federal Open Market Committee (FOMC). These results have been achieved with an abundant supply of reserve balances created in the banking system by large-scale asset purchases (LSAPs) from 2008 through 2014 and amid significant changes in U.S. money markets.2
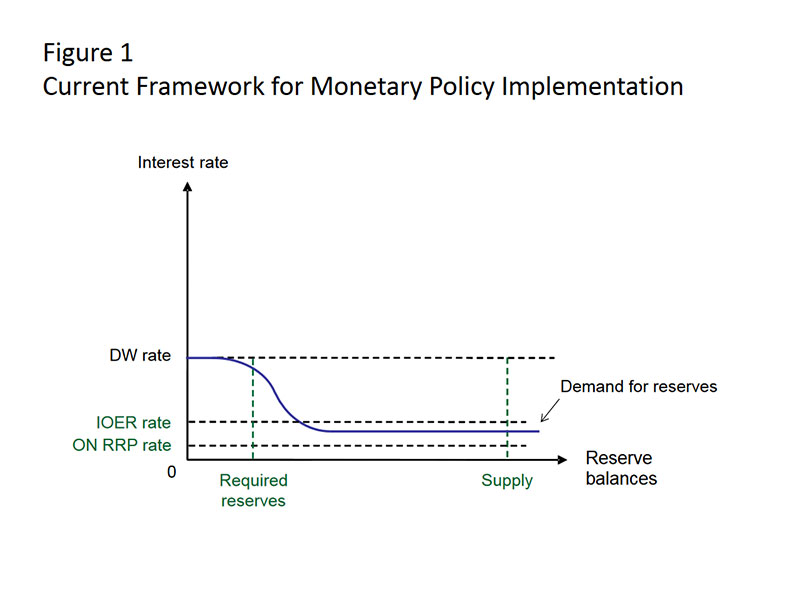
A central bank’s operational framework for implementing monetary policy is designed to control policymakers’ selected target, typically a short-term interest rate. Since December 2015, the Federal Reserve has been using a floor-style framework that allows us to change short-term interest rates while maintaining an abundant supply of reserve balances that has fluctuated in a wide range, mostly above $2 trillion. We can illustrate this framework with a stylized graph showing the relationship between the interest rate and banks’ demand for reserves (Figure 1). When reserves are scarce, the curve slopes steeply downward, and small variations in the supply of reserve balances produce sharp moves in interest rates. But when reserves become plentiful enough, banks’ demand flattens out, and interest rates become effectively insensitive to shifts in reserve supply. The interest rate at which the curve levels out reflects the return that banks receive on reserves held at the central bank. Thus, in a floor system, undesired upward movements in rates are prevented by making the supply of reserves abundant enough to intersect the flat part of the demand curve, while undesired downward movements are prevented by establishing the rate of interest paid on reserves held at the central bank.
The Federal Reserve’s implementation of a floor regime is unique in featuring two tools that help prevent the effective federal funds rate from falling appreciably below the FOMC’s target range. The primary tool—interest on reserves (IOR)—applies to the reserve balances held by banks in their accounts with the Federal Reserve.3 In principle, the federal funds rate should not fall below IOR, because depository institutions have no incentive to lend federal funds at interest rates below what they could earn simply by leaving the funds in their reserve accounts. However, a number of frictions have caused the effective federal funds rate to print moderately below IOR, leading the Federal Reserve to use a supplementary tool—a facility that offers overnight reverse repurchase agreements (ON RRPs) at a specified offering rate to a wide range of counterparties.4
The ON RRP facility helps to reinforce the floor under market interest rates by providing an outside investment option to a broad group of nonbank market participants that are not eligible to earn IOR.5 We’ve observed that a high volume of actual ON RRP usage has not been necessary to achieve interest rate control. In the first half of 2016, for example, average daily usage of the facility was $63 billion. In principle, even with zero usage, the ON RRP facility can support market rates by ensuring that counterparties demand rates on other investments at least as attractive as the rate offered on the Federal Reserve’s ON RRPs.
The ON RRP facility also serves as a flexible shock absorber that helps to maintain interest rate control when transitory shifts occur in the supply and demand for short-term market instruments. For example, around key month- and quarter-end reporting dates, some financial institutions shrink their balance sheets, a measure that reduces the availability of private money market investments, puts downward pressure on money market rates, and produces higher ON RRP take-up. Last fall, the ON RRP facility also helped to maintain rate control during the implementation of money market fund reform by temporarily absorbing heightened demand for safe, overnight investments by government money market funds.
Thus, with almost a year and a half of experience with a federal funds target above the zero lower bound, our current approach has so far proved to be both effective and resilient to structural changes in the market. The new framework is also quite simple and efficient from an operational perspective. To fully appreciate this, it’s useful to look back at the conduct of open market operations before the global financial crisis.
Open Market Operations in Money Markets Pre-Crisis
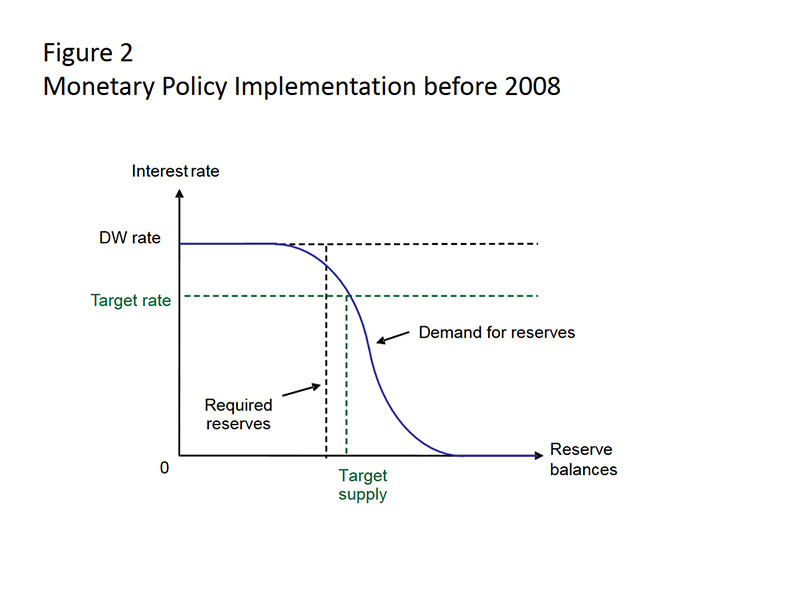
Prior to the crisis, the Federal Reserve’s operational framework was similar to a corridor system based on reserve scarcity.6 At that time, the Federal Reserve did not pay interest on reserves. Banks’ demand for reserves balanced the costs of falling short of their reserve requirements against the opportunity cost of holding too many non-interest-bearing reserves or of borrowing reserves at a penalty rate. This trade-off created a steeply downward-sloping demand curve for reserves (Figure 2). Facing that demand curve, the Desk conducted daily open market operations to bring the system’s aggregate supply of reserves to a level where it would meet the estimated demand at or near the FOMC’s target federal funds rate.7 Active interbank trading distributed these reserves within the system, between banks with a surplus of reserves and those with a deficit.
Managing the supply of reserves at levels that kept the federal funds rate from moving too high or too low was a technically challenging exercise that required both market knowledge and expert judgment.8 Reserve forecasters on the Desk and at the Federal Reserve Board of Governors projected various elements that could affect the supply of and demand for reserves over multiple days ahead. Anticipating changes in the supply of reserves required a detailed understanding of numerous factors, many of which were driven by forces outside the control of the Federal Reserve—so-called “autonomous factors,” such as balances held by the Treasury in its account at the Federal Reserve or physical U.S. currency held by the public. To determine the demand for reserves, staff gathered information to estimate banks’ reserve needs and plans for meeting them over each two-week reserve maintenance period.9 Using this information, staff planned open market operations—specifically, overnight and term repurchase agreements, and purchases of Treasury securities—to affect reserve conditions throughout each maintenance period. Uncertainty about various factors, such as swings in banks’ clearing needs, meant that fluctuations in banks’ demand for reserves could not be completely forecasted, especially on a daily basis, but even predictable variations resulted in the need for open market operations on most days.
In normal times, we were reliably proficient in hitting the FOMC’s target rate. However, interest rate control was more challenging at times when autonomous factors or the demand for reserves was harder to predict. These challenges were particularly acute during the early stages of the financial crisis, when large changes in reserve demand caused significant intraday swings in federal funds rates.10 A framework based on actively managing the supply of reserves was, from an operational perspective, also a discretionary and interventionist approach, albeit one that required only small adjustments on most days. Moreover, the pre-crisis framework created costly cash management regimes for banks, which had to meet reserve requirements and avoid overnight overdrafts in an environment with reserve scarcity and the high opportunity costs entailed by holding reserves.
Open Market Operations in Money Markets Today
The Desk’s role now is quite different. With reserve balances far in excess of banks’ reserve requirements, the Desk cannot meaningfully influence the federal funds rate by changing the supply of reserves, so the Federal Reserve achieves control over the federal funds rate by setting rates on various central bank liabilities.
The Desk’s operational charge for maintaining the federal funds rate in the FOMC’s target range is now centered on running the ON RRP facility. On a daily basis, the Desk auctions ON RRPs at an offering rate and aggregate offering limit set by the FOMC. The operation is based on price, not quantity, so there is nothing to forecast ahead of time.11 Market forces then keep the federal funds rate within the FOMC’s target range by pricing private trades against the alternative option of investing with the Federal Reserve, rather than by having interbank trading redistribute reserves throughout the system, as it did before the crisis. However, this approach relies on the Desk maintaining a larger and more heterogeneous set of counterparty relationships than before the crisis.
We support this framework with substantial market analysis, but the nature of the analysis has changed. The current framework does not require high-frequency forecasts of factors affecting the supply of and demand for reserves. Instead, we analyze trading dynamics and relationships among a broad set of market participants to build knowledge about how our tools affect private sector trading incentives and how market developments might affect policy implementation. This knowledge helps us to better understand the first steps in the transmission of the monetary policy stance, to assess the efficacy of policy implementation, and to provide advice on how the Federal Reserve could adjust the framework and tools if needed to ensure they remain effective.12
What Could the Monetary Policy Implementation Framework Look Like in the Future?
The current framework was developed as a means for the Federal Reserve to normalize the stance of monetary policy after the extraordinary balance sheet expansion that was undertaken in the aftermath of the crisis, but policymakers have begun to consider what framework to use in the longer run.13 In a preliminary discussion about the long-run monetary policy implementation framework held in November 2016, FOMC participants commented on the advantages of an approach to policy implementation similar to the one currently in use, in which active management of the supply of reserves would not be required. They noted that such an approach could be compatible with a balance sheet that was much smaller than the current one, though likely at least somewhat larger than the pre-crisis balance sheet. Such an approach was seen as “likely to be relatively simple and efficient to administer, relatively straightforward to communicate, and effective in enabling interest rate control across a wide range of circumstances.”14 However, policymakers made no decisions on these issues and acknowledged that they expected to learn from additional experience before making such judgments.
In the meantime, I believe it is important that we continue to consider what a “new normal” might look like in order to ensure operational and analytical readiness—just as we spent several years preparing to raise the federal funds rate away from zero by expanding counterparties, developing and testing ON RRPs and various types of term reserve-draining operations, and enhancing our collection of data on money market activity.
What Might the Balance Sheet and Open Market Operations Look Like in the Future?
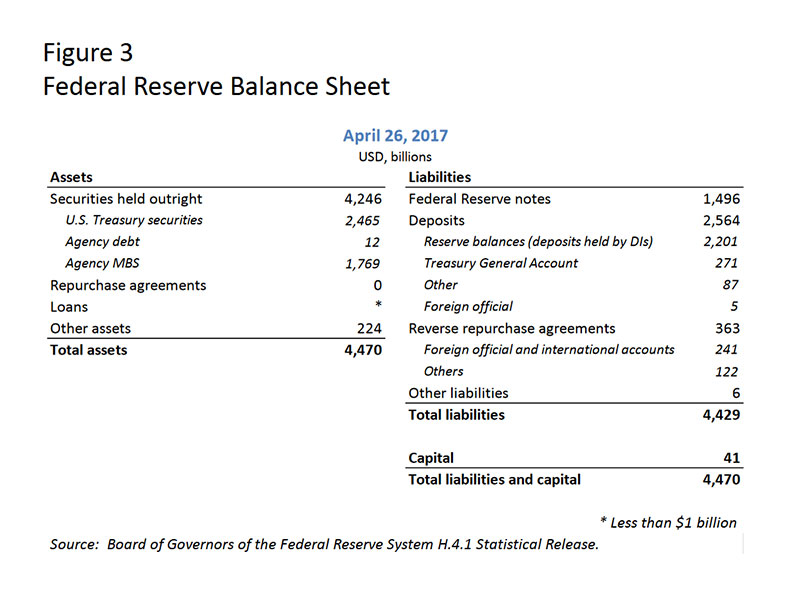
The FOMC’s statement on Policy Normalization Principles and Plans notes that in the long-run, the FOMC intends to “hold no more securities than necessary to implement monetary policy efficiently and effectively.” It is challenging to determine far in advance what balance sheet size would accomplish this objective. However, it is probable that the normalized balance sheet will be considerably larger than its pre-crisis level, even before considering the volume of reserves that the FOMC would decide to supply. The reason is that recent growth trends in the Federal Reserve’s non-reserve liabilities will augment the necessary size of the normalized balance sheet independent of the operational framework adopted by the FOMC in the long run. To understand this point, it’s useful to consider the liability side of the Federal Reserve’s current balance sheet (Figure 3).
First, currency in circulation—a central bank’s traditional liability—remains a large and growing balance sheet item. Federal Reserve notes outstanding have nearly doubled since the start of the crisis, with a current level of about $1.5 trillion, implying that currency demand alone requires a much larger balance sheet than before the crisis. A simple assumption is that U.S. currency in circulation will grow in line with nominal U.S. GDP growth. However, it is easy to imagine shocks that could materially affect currency growth, either positively or negatively. For example, with heavy usage of U.S. paper currency overseas, demand for dollars appears sensitive to changes in global growth and financial and geopolitical stability.15 In addition, it is hard to know what longer-term implications financial technology will have for currency demand.
Second, the U.S. Treasury holds cash balances at the Federal Reserve in the Treasury General Account (TGA), its primary “checking account.” Before the crisis, Treasury targeted a TGA balance of $5 billion on most days; those balances increased during the global financial crisis. In May 2015, the Treasury announced plans to hold a level of cash generally sufficient to cover one week of outflows to help protect against a potential interruption in market access.16 Since that cash management policy went into effect, TGA balances have averaged around $250 billion, reaching as high as $440 billion.
Third, designated financial market utilities (DFMUs) can now establish and hold cash deposits in Reserve Bank accounts.17 The buildup of DFMU balances has prompted “other deposits” on the Federal Reserve's balance sheet to grow steadily over recent years to a current level of about $85 billion, compared to a pre-crisis average of less than $1 billion. The other deposits category also includes balances held by GSEs and international and multilateral organizations.18
Fourth, the Federal Reserve has long offered an overnight repurchase agreement investment to foreign official and international account holders—a service known as the foreign repo pool. The foreign repo pool has grown from an average level of around $30 billion before the crisis to an average of about $250 billion now. The rise reflects foreign central banks’ preferences to maintain robust dollar liquidity buffers, reduced availability of alternative low-risk investment options with private counterparties, and the New York Fed’s removal of constraints on account holders’ ability to vary the size of their investments.
In projecting the size of the normalized balance sheet, one can make assumptions about the long-run trends that will determine future levels for each of these non-reserve liabilities, subject to various kinds of uncertainty. Even taken at today’s levels, the TGA, other deposits, and the foreign repo pool alone account for about $600 billion of the Federal Reserve’s current balance sheet size. Adding on currency outstanding brings this set of non-reserve liabilities to $2.1 trillion today, and this set is likely to grow as the economy continues to expand. This sum does not yet consider reserves or ON RRPs.
The ON RRP facility, which has averaged around $165 billion this year, is another non-reserve liability that one might need to factor into balance sheet projections. The FOMC has said that it plans to phase out the ON RRP facility when it is no longer needed to help control the federal funds rate. However, as mentioned earlier, the facility has been a useful shock absorber amid structural changes in money markets, and it may be that some such facility would be helpful in maintaining effective interest rate control should the FOMC decide to remain in a floor system in the longer run. Of course, a decision to maintain an ON RRP facility would require longer-term choices about counterparty relationships and consideration of possible financial stability risks.19
Finally, to complete projections for the normalized size of the balance sheet, we must consider reserve balances, currently the Federal Reserve’s largest liability. Two components will help shape the long-run level of reserve balances: banks’ demand for reserves and what, if any, additional supply of reserves might be deemed appropriate for the efficient and effective implementation of monetary policy.
The precise shape and position of banks’ demand curve is not currently known, but we generally understand the key forces that are likely to influence it. Changes in bank liquidity regulation and supervision since the crisis will be particularly important.20 In this new environment, we will need to consider the relative attractiveness of rates paid on reserves and close substitutes, such as Treasury securities, as well as banks’ propensity to substitute between these assets in meeting their liquidity requirements. Other characteristics of reserves may boost their inherent appeal—for example, intraday liquidity that supports clearing and settlement activities, or perceptions that holding reserves makes an institution safer. These factors are likely to contribute to higher and more variable demand for reserves than banks had before the crisis. If the demand curve for reserve balances has indeed shifted out, then a greater supply of reserves will be needed to attain a given interest rate target.
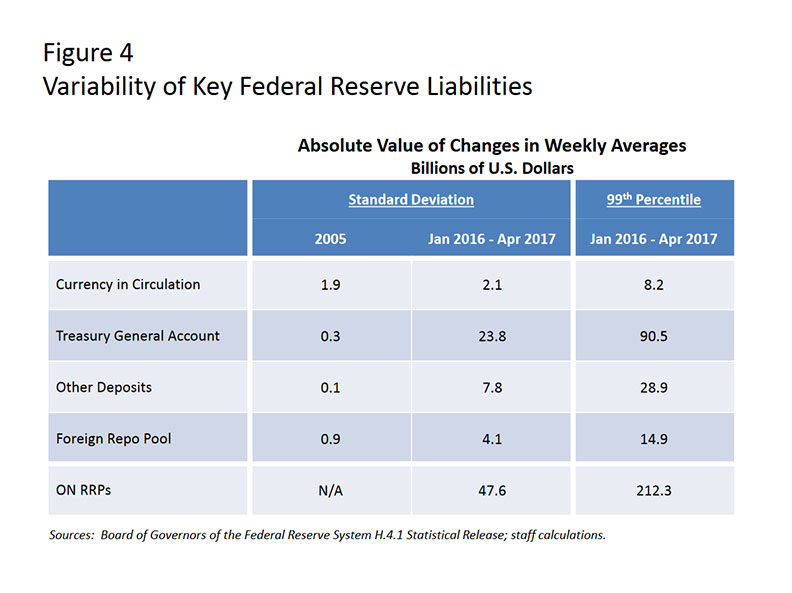
Moreover, it is important to take into account how uncertainty and increased variability in the non-reserve liabilities I’ve discussed could warrant an additional supply of reserves (Figure 4). For example, TGA balances exhibit significant day-to-day variation stemming from the settlement of securities and the receipt of tax payments. All else equal, changes in non-reserve liabilities have the opposite effect on the supply of reserves. What these variations will mean for the amount of reserves the Federal Reserve decides to supply—and also for the size of the normalized balance sheet and the types of open market operations that will be employed—will depend heavily on the operational framework the FOMC chooses in the longer run.
To remain in a floor system, the Federal Reserve would need to supply enough reserves to satisfy bank demand along the flat portion of the reserves demand curve. It would also need to ensure that even amid shocks to non-reserve liabilities, the supply of reserves would stay on the flat part of the demand curve. There are essentially three ways to accomplish that objective. First, as in the past, the Federal Reserve could establish limits for the overall size of or daily variations in non-reserve account balances. Second, the Desk could carry out open market operations to offset fluctuations in reserve-absorbing factors, similar to what we did in our pre-crisis framework but at a lower frequency. Third, the balance sheet could include an additional buffer of excess reserves sufficient to ensure that most shocks would still leave us safely to the right of the steep part of the demand curve. Providing this additional buffer would require that the Federal Reserve retain a corresponding amount of assets.
An important trade-off in a floor system arises between the size of that additional buffer and the frequency and size of open market operations. In the current floor framework, the buffer is more than large enough to absorb shocks without the need to conduct offsetting open market operations. In fact, the level of reserve balances has fluctuated by as much as $700 billion since the start of 2016 with no material impact on federal funds market dynamics. To project the balance sheet’s long-run size, one could try to estimate the size of a conservative buffer by examining the distribution of changes in currency, the TGA, other deposits, and the foreign repo pool. Data since January 2016 suggest an additional buffer of reserves of about $145 billion would absorb 99 percent of changes in the daily average holdings of these liabilities from week to week (Figure 4). Accounting for variability in ON RRPs could add another $215 billion to the buffer.21
In a floor system with a buffer that would sufficiently accommodate swings in non-reserve liabilities, IOR would continue to be the primary tool to maintain interest rate control, perhaps supported by ON RRPs if needed. In addition, the Federal Reserve would still need to conduct some reserve-adding open market operations, but only periodically, to accommodate trend growth of balance sheet items like currency; otherwise, the quantity of reserves would eventually be smaller than that needed for efficient and effective policy implementation.
However, if the FOMC wanted to maintain a somewhat smaller balance sheet, it might prefer to operate a floor system with a smaller buffer. In this case, the Desk would have to use regular reserve-adding open market operations to offset transitory shocks to reserve-absorbing factors in addition to secular trends. The smaller the buffer, the more the Desk’s operational schedule and supporting analysis would need to focus on short-run changes in demand for the Federal Reserve’s liabilities.
Returning to a corridor system, in which we operate on the steep part of the demand curve, would mean an even smaller balance sheet. Daily forecasting and frequent open market operations would once again be required to manage the supply of reserves in the face of either reserve-adding or reserve-absorbing shocks in order to maintain interest rate control.
One could put together all of these elements—one’s projected levels for the range of non-reserve liabilities and assumptions about the supply of reserves—to arrive at some rough estimates of the range of balance sheet sizes that would be required under these different operational frameworks.22 However, the uncertainties surrounding these factors at this stage are very large. Furthermore, the variability of these factors over time suggests that the size of the balance sheet that best balances the trade-offs will evolve as the structure of money markets and other factors change. In practice, it will likely be necessary for the Federal Reserve to closely monitor the behavior of money markets as its balance sheet shrinks, and to use that information to enhance our understanding of the evolution of the demand for reserves and the other, non-reserve liabilities.
How Might We Know When We Are Getting Close to a Normalized Balance Sheet Size?
The FOMC is currently maintaining the size of the Federal Reserve’s balance sheet by reinvesting payments of principal on its securities holdings and has said that it anticipates continuing to do so until normalization of the level of the federal funds rate is well underway. When the FOMC reduces its securities holdings, the supply of reserves will also shrink. As that process occurs, understanding evolving money market dynamics and the structure of the reserves market will be a central component of the Desk’s analytical agenda—regardless of whether the FOMC decides to remain in a floor system or return to a corridor system. A key focus for interest rate control will be assessing the shape and position of the reserve demand curve and interpreting financial market conditions to gauge how far we are from the steep portion of it. Our thinking on this is still evolving, but let me offer a few thoughts.
Upward pressure on overnight interest rates is the most direct indicator that reserves are becoming scarce. If the FOMC were to return to a corridor system, this would be the main indicator we would need. An increase in rates would likely suggest that reserve supply had moved onto the steep part of the demand curve, exhibiting the desired reserve scarcity that is associated with this type of operational framework. In assessing when to stop reducing the balance sheet to remain in a floor system, however, upward pressure on rates might not be as useful an indicator. Although brief increases in rates might not be materially adverse, a longer-lasting rise in rates would be a sign that reserves had already become scarcer than needed to maintain interest rate control. Thus, for a floor system, it will be important to develop and assess more forward-looking indicators to signal impending reserve scarcity.
Data from the Federal Reserve’s Report of Selected Money Market Rates (FR 2420) provide visibility into transactions in a range of unsecured funding markets and could be leveraged to develop some such indicators. Changes in the distribution of traded funding rates or in the nature of trading in the federal funds market might be signs that conditions in money markets were becoming more directly influenced by the amount of reserves. For example, most market activity today is characterized by banks borrowing from nonbanks to earn IOR. As reserves are reduced, a shift towards banks borrowing reserves to cover unexpected shortfalls could be a sign of mounting reserve scarcity. Banks needing to cover shortfalls might borrow from nonbanks at rates closer to IOR or from banks, likely at rates above IOR (since banks are unlikely to lend reserves at a rate below what they could earn if they left the funds in their reserve account).23
Monitoring correlations between trade volumes and rates might also be informative. Higher volumes accompanied by lower rates—a negative correlation—could suggest an increase in arbitrage activity as banks try to earn the spread between market rates and IOR, while a positive correlation between volumes and rates could indicate that banks need to borrow reserves at relatively high rates at the end of the day to cover reserve shortfalls.24
Conclusion
To sum up: The Federal Reserve’s framework for implementing monetary policy has evolved quite substantially since the financial crisis. The unique floor system we’ve adopted to influence short-term interest rates, which uses interest on reserves and overnight reverse repos as support, has given the FOMC excellent control of the federal funds rate and supported efficient transmission to other money market rates.
In the longer run, the Federal Reserve could choose to retain the floor system to implement monetary policy or shift back to a corridor system. Under either operational framework, the balance sheet would decline significantly from its current size, but remain substantially larger than it was pre-crisis in order to accommodate its non-reserve liabilities and to supply an appropriate quantity of reserves. Moreover, the balance sheet’s size will change over time, driven by changes in longer-run demand for various Federal Reserve liabilities.
If the Committee remains in a floor system, the Federal Reserve will need to supply enough reserves to satisfy demand along the flat portion of the reserve demand curve plus, perhaps, an additional buffer to absorb variability in demand for non-reserve liabilities. These considerations would contribute to a larger balance sheet than in a corridor system. The size of the buffer would influence the need to conduct open market operations to offset temporary shocks, so policymakers would need to consider a trade-off between a larger balance sheet that accommodates this buffer and the complexity associated with more active forecasting and open market operations.
Once the Committee begins to reduce the balance sheet, we will track market dynamics to gauge the impact of declining reserve balances. Given the uniqueness of the current operational framework and the substantial ongoing changes in money markets, this task will present an interesting challenge for the staff, and one that we are preparing for as we carry out our operational and analytical responsibilities.
Thank you. I would be happy to answer any questions.