-
-

The Teller Window is a publication featuring expert knowledge and insight from the New York Fed, including thoughts and perspectives from senior leaders.

Do you have a request for information and records? Learn how to submit it.

Learn about the history of the New York Fed and central banking in the United States through articles, speeches, photos and video.
-
-
-

The Governance & Culture Reform hub is designed to foster discussion about corporate governance and the reform of culture and behavior in the financial services industry.

Need to file a report with the New York Fed? Here are all of the forms, instructions and other information related to regulatory and statistical reporting in one spot.

The New York Fed works to protect consumers as well as provides information and resources on how to avoid and report specific scams.
-
-
-

The New York Innovation Center bridges the worlds of finance, technology, and innovation and generates insights into high-value central bank-related opportunities.

The growing role of nonbank financial institutions, or NBFIs, in U.S. financial markets is a transformational trend with implications for monetary policy and financial stability.

The New York Fed offers the Central Banking Seminar and several specialized courses for central bankers and financial supervisors.
-
-
New Brunswick Metro Area
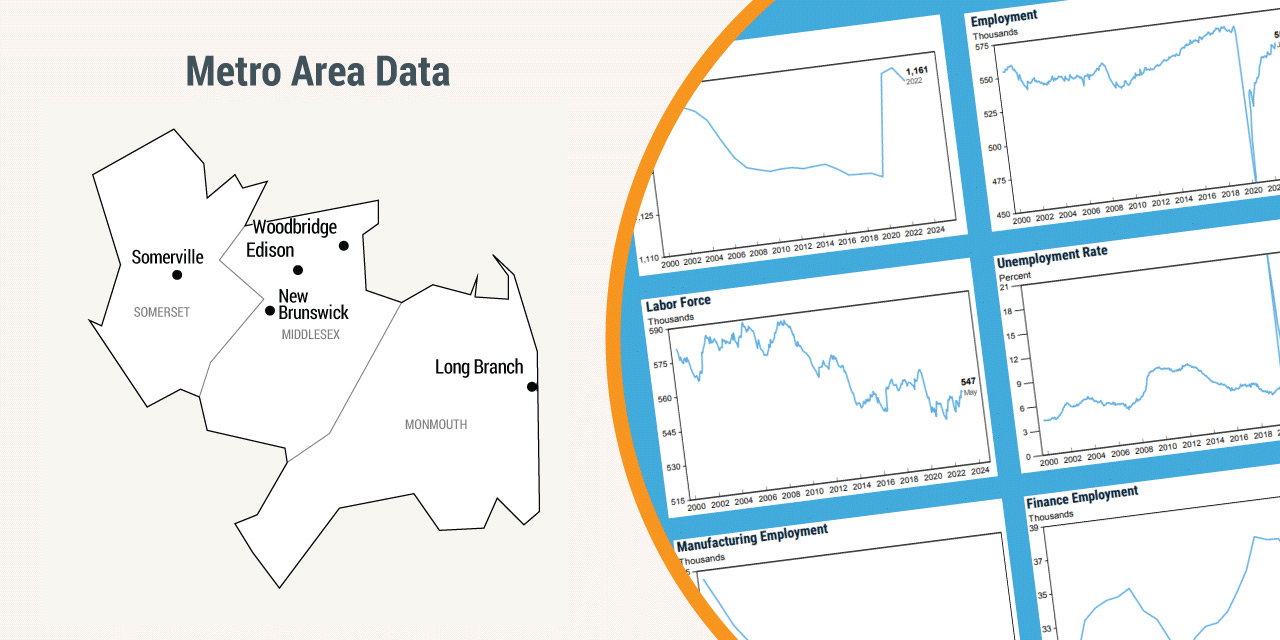
| Population 2024 | Pop growth 2024, 10-year change (%) | GDP 2023, billions ($) | Job growth 2024, 5-year change (%) | Median household income 2023 ($) | Median home price 2023 ($) | Pop share age 25+ with BA+ 2023 (%) | |
| New Brunswick Metro | 1,895,106 | 4.5 | 187 | 4.5 | 105,000 | 450,000 | 46.4 |
| Newark Metro | 2,277,892 | 6.1 | 207 | 3.0 | 100,000 | 500,000 | 45.1 |
| Bergen-Hudson-Passaic | 2,241,423 | 5.2 | 191 | 2.3 | 98,000 | 500,000 | 47.6 |
| New Jersey | 9,500,851 | 5.1 | 807 | 4.0 | 98,000 | 450,000 | 44.1 |
| United States | 340,110,988 | 6.5 | 27,812 | 4.7 | 76,170 | 325,000 | 36.2 |
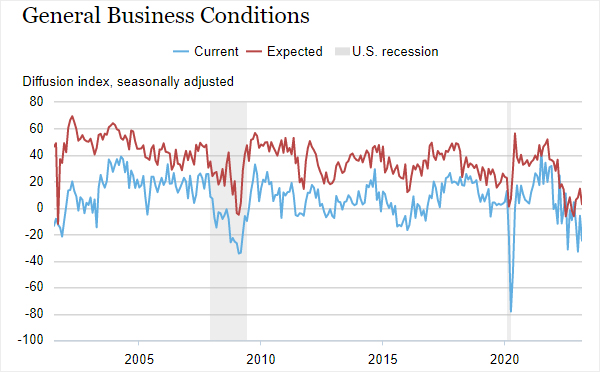
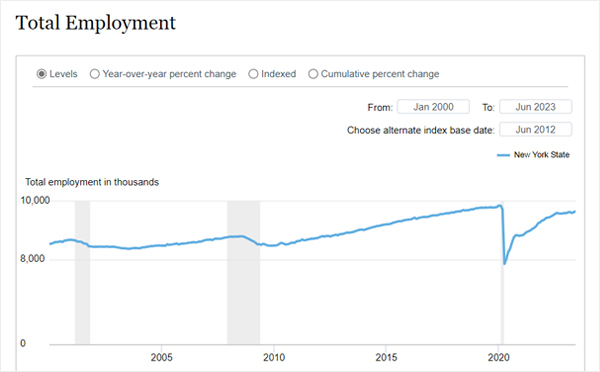
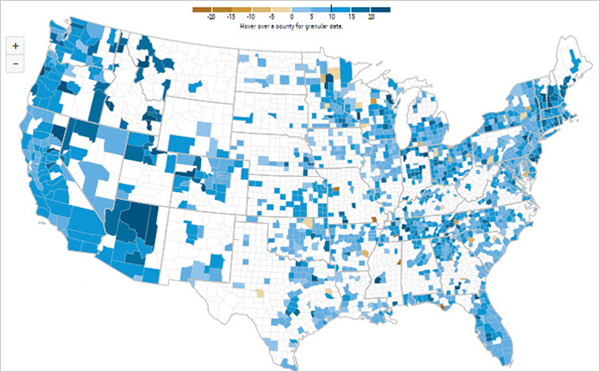
The New York Fed publishes indicators, trends, research and analysis on our Second District. Explore the content below to learn more.


March 4, 2026

March 4, 2026

March 4, 2026